Core Equity: Q2 2024
April 29, 2025

The new plans for tariff policy threaten to raise prices further and slow economic growth. This will make it very challenging for the Fed; if they use monetary policy to combat one aspect, it may make the other worse. This is the stagflation paradox, which is characterized by high inflation and a high unemployment rate. Until the 1970s, economists generally thought it would be impossible for stagflation to exist. It was broadly believed that if inflation got too high, a central bank would raise interest rates, slowing demand, and prices would fall. If the unemployment rate got too high, it would reduce interest rates, demand would pick up, and the unemployment rate would decline. But the 1970s oil crisis changed that. An outside force kept the oil price high no matter what was going on regarding the change in demand. Tariffs can have the same impact on the economy.
The Fed has warned that it is unclear what the correct policy action is at this time. One pending issue is where the tariff rates settle. Countries may be able to negotiate their reciprocal rate downward. The current estimate of the average tariff rate is around 28%, a big jump from the sub-3.0% it was at (Chart 1).
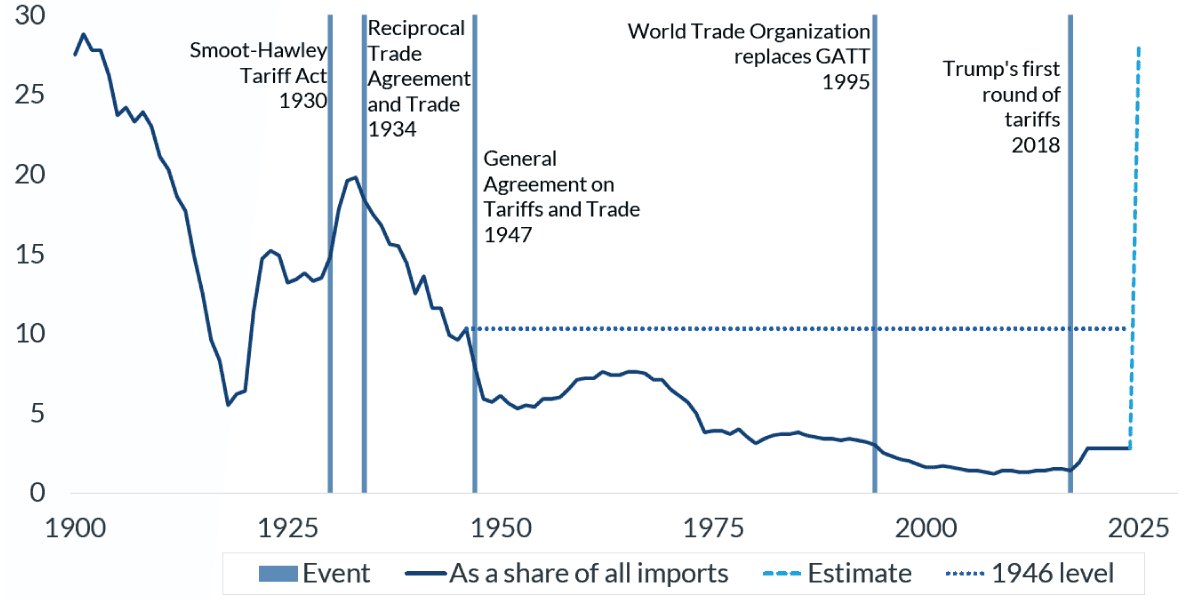
Source: U.S. Department of Commerce, Estimate from The Budget Lab at Yale, as of April 15, 2025.
Past performance is no guarantee of future results.
Fortunately for the Fed, the inflation rate is not significantly above its projected trend line toward 2.0%, and the economy is robust, with a low unemployment rate and strong balance sheets for households and corporations. This buys the Fed time to study the economic impact of the tariffs. There are several unanswered questions: Will the administration negotiate different tariff rates on some reciprocal tariffs? How will the tariffs impact consumer spending and business investment? Most importantly, will the tariffs lead to a trade war or just higher prices and a slower economy?
As for the financial markets, they now believe the Fed will need to cut the overnight federal funds rate by almost 100 basis points, a sharp change from two months ago when it was less than 25 bps (Chart 2).
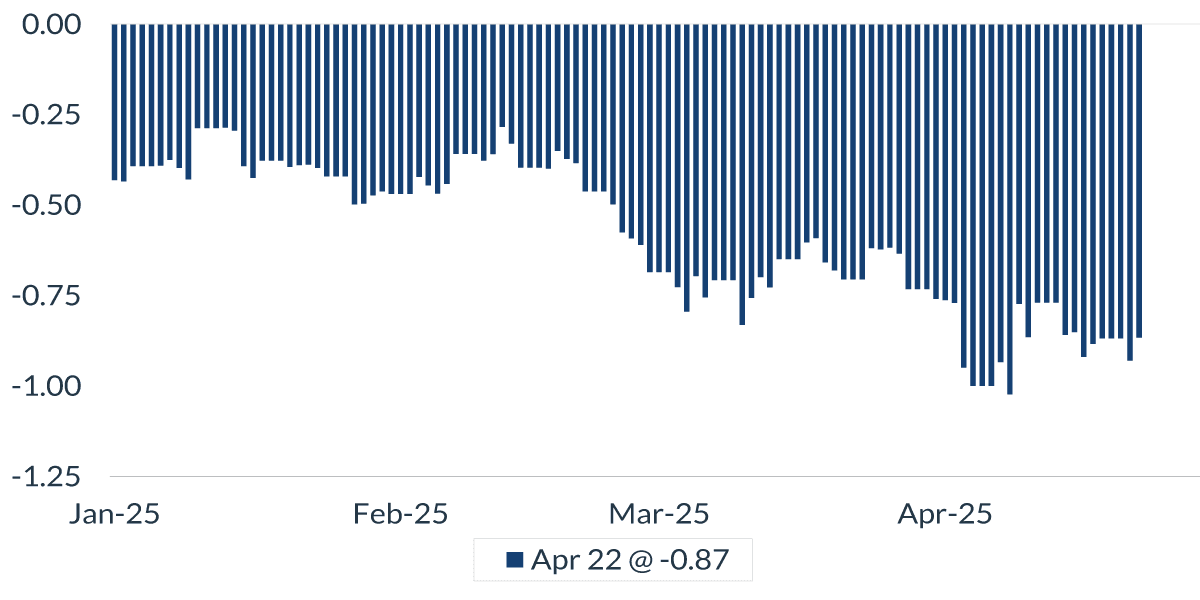
Source: Bloomberg’s WIRP page, as of April 22, 2025.
Past performance is no guarantee of future results.
Important Information
The views expressed represent the opinions of City National Rochdale, LLC (CNR) which are subject to change and are not intended as a forecast or guarantee of future results. Stated information is provided for informational purposes only, and should not be perceived as personalized investment, financial, legal or tax advice or a recommendation for any security. It is derived from proprietary and non-proprietary sources which have not been independently verified for accuracy or completeness. While CNR believes the information to be accurate and reliable, we do not claim or have responsibility for its completeness, accuracy, or reliability. Statements of future expectations,estimates, projections, and other forward-looking statements are based on available information and management’s view as of the time of these statements. Accordingly, such statements are inherently speculative as they are based on assumptions which may involve known and unknown risks and uncertainties. Actual results, performance or events may differ materially from those expressed or implied in such statements.
All investing is subject to risk, including the possible loss of the money you invest. As with any investment strategy, there is no guarantee that investment objectives will be met, and investors may lose money. Diversification may not protect against market risk or loss. Past performance is no guarantee of future performance.
© 2025 City National Bank. All rights reserved.
Index Definitions
S&P 500 Index: The S&P 500 Index, or Standard & Poor’s 500 Index, is a market-capitalization-weighted index of 500 leading publicly traded companies in the US It is not an exact list of the top 500 US companies by market cap because there are other criteria that the index includes.
Bloomberg Municipal Bond Index: The Bloomberg US Municipal Bond Index measures the performance of investment grade, US dollar-denominated, long-term tax-exempt bonds.
Bloomberg Municipal High Yield Bond Index: The Bloomberg Municipal High Yield Bond Index measures the performance of non-investment grade, US dollar-denominated, and non-rated, tax-exempt bonds.
Bloomberg Investment Grade Index: The Bloomberg US Investment Grade Corporate Bond Index measures the performance of investment grade, corporate, fixed-rate bonds with maturities of one year or more.
The Bloomberg Magnificent 7 Total Return Index: Bloomberg Magnificent 7 Total Return Index is an equal-dollar weighted equity benchmark consisting of a fixed basket of 7 widely-traded companies classified in the United States and representing the Communications, Consumer Discretionary and Technology sectors as defined by Bloomberg Industry Classification System (BICS).
Nasdaq is a global electronic marketplace for buying and selling securities. Its name was originally an acronym for the National Association of Securities Dealers Automated Quotations.
The Dow Jones Industrial Average (DJIA) tracks thirty of America’s biggest and most established companies, acting like a quick temperature check of the U.S. economy.
The MSCI USA Large Cap Index is designed to measure the performance of the large cap segments of the US market. The index covers approximately 70% of the free float-adjusted market capitalization in the US.
The Bloomberg Investment Grade Corporate Bond Spreads refer to the spreads between investment grade, fixed-rate, taxable corporate bonds.
BVAL Municipal AAA Benchmark is a municipal bond benchmark. It provides a 5% coupon benchmark yield curve for high-quality US municipal bonds with an average rating of “AAA” from Moody’s and S&P.
The 10-year BVAL AAA municipal treasury index compares the yield on a AAA rated municipal bond to that of a Treasury before factoring in the effect of taxes.
The Morningstar LSTA US Leveraged Loan 100 Index is designed to measure the performance of the 100 largest facilities in the US leveraged loan market.
The ICE BofA Diversified High Yield US Emerging Markets Corporate Plus Index tracks the performance of US dollar denominated below investment grade emerging markets non-sovereign debt publicly issued in the major domestic and eurobond markets.
The Palmer Square CLO Senior Debt Index is a rules-based observable pricing and total return index for CLO debt for sale in the United States, rated at the time of issuance as AAA or AA (or an equivalent rating).
The Russell 3000 is a broad equity index composed of the 3,000 largest U.S. listed stocks, representing more than 95% of the investable American stock market.
The MSCI ACWI ex USA Index captures large and mid cap representation across Developed Markets (DM) countries (excluding the US) and Emerging Markets (EM) countries. The index covers approximately 85% of the global equity opportunity set outside the US.
Definitions
The “core” Personal Consumption Expenditures (PCE) price index is defined as prices excluding food and energy prices. The core PCE price index measures the prices paid by consumers for goods and services without the volatility caused by movements in food and energy prices to reveal underlying inflation.
A leveraged loan is a type of loan that is extended to companies or individuals that already have considerable amounts of debt or poor credit history.
Yield to worse (YTW) is the lowest potential yield that an issuer can pay on a bond without defaulting.
The Magnificent 7 refers to a group of major tech companies with stock growth that far outpaced the high-performing S&P 500 in recent years. Coined in 2023, the group consists of Alphabet, Amazon, Apple, Meta Platforms, Microsoft, Nvidia, and Tesla.
© 2025 City National Bank. All rights reserved.
Non-deposit investment Products are: • not FDIC insured • not Bank guaranteed • may lose value
If you have a client with more than $1 million in investable assets and want to find out about the benefits of our intelligently personalized portfolio management, speak with an investment consultant near you today.
If you’re a high-net-worth client who's interested in adding an experienced investment manager to your financial team, learn more about working with us here.