
Videos › Economic Perspectives › April 2026
-
Economic Perspectives
Domestic Manufacturing: Making a Comeback?
April 2026
- Filename
- Economic Perspectives April 2026.pdf
- Format
- application/pdf

TRANSCRIPT
It has been a year since the tariffs were imposed. One of the goals of the tariffs was to bring manufacturing jobs back within our domestic shores. This issue has broad bipartisan support. Sometimes it is called “re-shoring” or “reindustrialization,” but the objective is simple: to increase the number of manufacturing jobs following decades of decline. When looking at many traditional manufacturing reports, there has been little change over the past year. But there are signs of powerful tailwinds that are altering that trajectory. Let’s look at some charts.
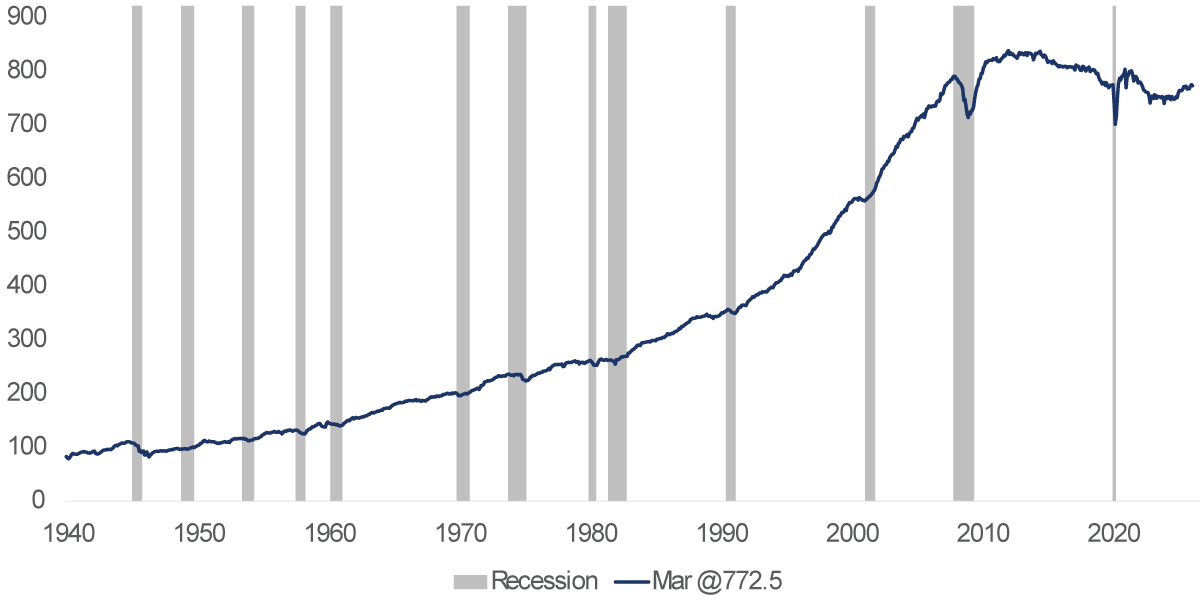
Labor: Manufacturing
millions, seasonally adjusted
Data current as of: March 21, 2026
Source: Bureau of Labor Statistics
Information is subject to change and is not a guarantee of future results.
Chart 1, 0:48– This is a long-term view of manufacturing employment, since 1940. You can see the wartime surge; manufacturing employment increased by almost 7 million workers, a 70% increase in about 3.5 years.
In the post-war period, the manufacturing workforce continued to grow, as the United States was the world’s manufacturing juggernaut. Our factories remained intact, and our workforce was well-educated. Manufacturing labor peaked in 1979 at almost 20 million workers. Since then, it has declined by about 12.5 million due to technological advances in manufacturing and trade, especially imports from Asia, particularly China. During that time, NAFTA was enacted in 1994, and China joined the World Trade Organization at the end of 2001.
The light blue-shaded area is measuring the amount of manufacturing workers as a percentage of the total workforce. It has been on a gentle downward trend since 1943. In 1943, it represented 1 in 3 workers. Now, it's 1 in 12 that are working in the manufacturing sector. The change isn't due to just jobs being pushed offshore- we still manufacture a lot domestically. The United states is the second largest manufacturer in the world. This clearly shows the transformation to a service-based economy.
Manufacturing Productivity
industiral production manufacturing index/millions of manufacturing workers
Data current as of: March 21, 2026
Source: Bureau of Labor Statistics, Federal Reserve
Information is subject to change and is not a guarantee of future results.
Chart 2, 2:17– It is important to note that the entrepreneurship and ingenuity of American workers have been in full force. This is a chart of productivity advances. It is simply the amount of manufactured output divided by the number of manufacturing workers. Back in 1940, it was around 100; now it is close to 800. During that time, their output is nearly eight times greater. As a result, there isn't a need for as many workers as there has been in the past.
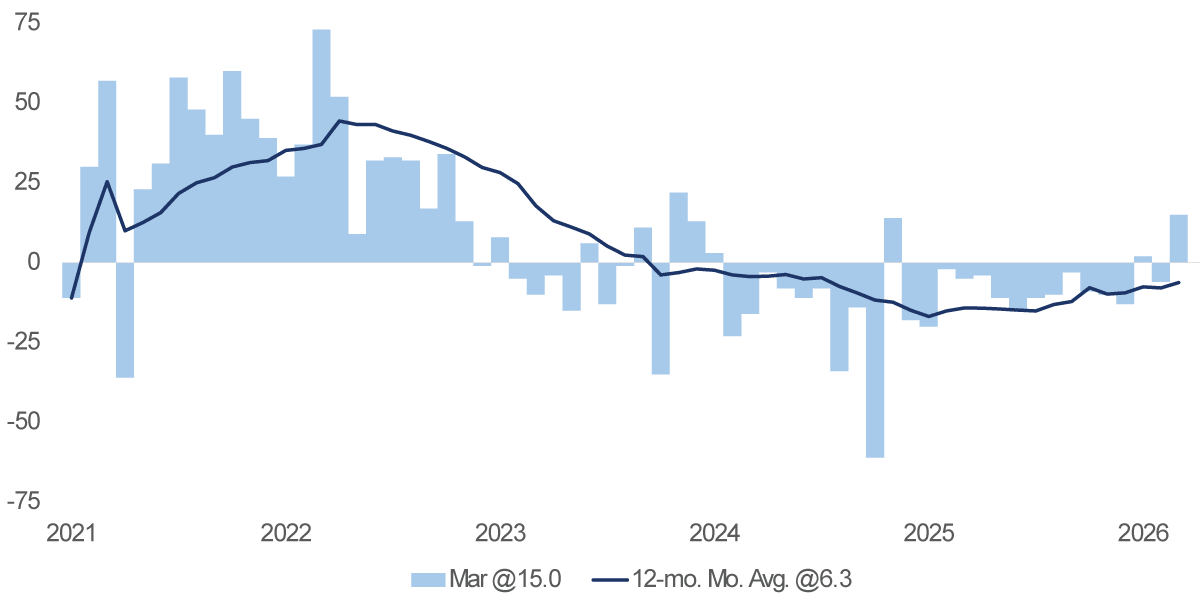
Labor: Manufacturing
'000, seasonally adjusted
Data current as of: March 21, 2026
Source: Bureau of Labor Statistics
Information is subject to change and is not a guarantee of future results.
Chart 3, 2:48– But back to labor demand, for a contemporary view, the light blue columns show the monthly change in manufacturing payrolls, and the dark blue line shows the running 12-month average. As you can see, payroll growth turned negative in 2023, following the post-pandemic surge.
Labor: Manufacturing
'000, 6-mo. mov. avg., seasonally adjusted
Data current as of: March 21, 2026
Source: Bureau of Labor Statistics
Information is subject to change and is not a guarantee of future results.
Chart 4, 3:07– This is a different report from the Labor Department. It gives more detail on the ebbs and flows of labor turnover within the manufacturing sector. Starting at the bottom, the yellow line shows the average number of layoffs per month. You can see the jump in 2020 when the pandemic recession started. The brown line shows the number of workers leaving their positions, which increased following the pandemic recession. They were off getting a better job, probably with higher pay. The blue line is the number of hires, which, of course, jumped after the pandemic recession. Finally, the light blue shaded areas show the number of job openings.
I would like to focus on the recent period. Light blue (job openings) has shifted up, and yellow (layoffs) has shifted down. Yes, they are subtle moves, but it may be the very early stages of a positive shift in manufacturing employment.
ISM: Manufacturing
%, not seasonally adjusted diffusion index,
>50 is expansion, <50 is contraction
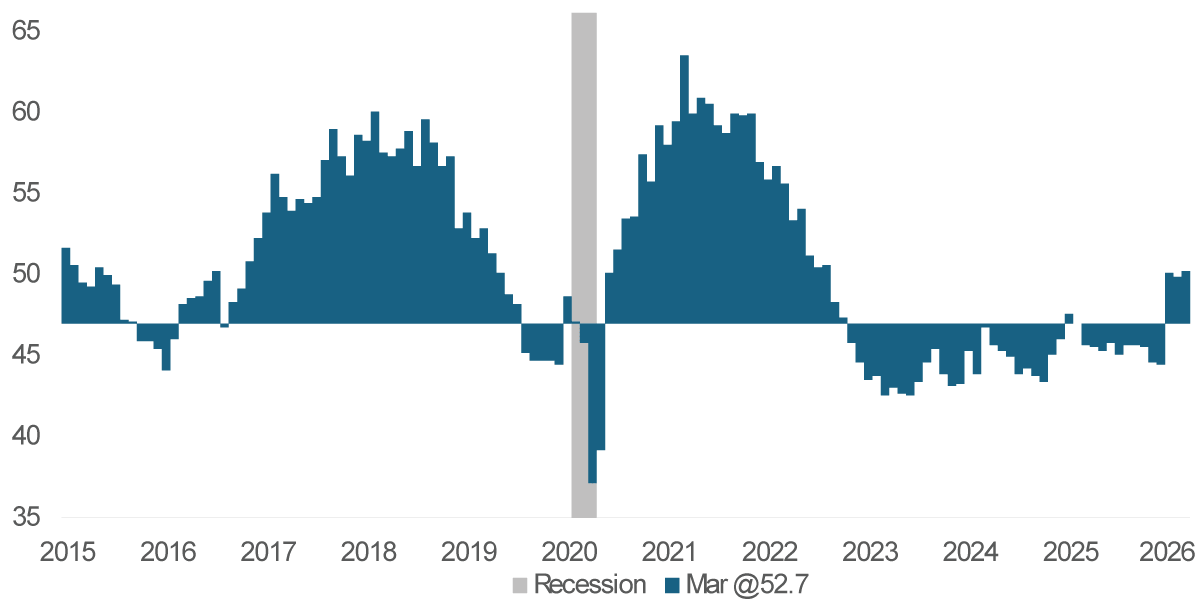
Data current as of: March 21, 2026
Source: Institute of Supply Management
Information is subject to change and is not a guarantee of future results.
Chart 5, 4:02– This is a chart from the ISM Manufacturing report, where ISM stands for the Institute for Supply Management. They produce a report released on the first business day of each month based on a national survey of purchasing managers tracking changes in the manufacturing sector. This report has been around since the late 1940s and is considered one of the most reliable economic indicators of the U.S. economy. This is a diffusion index: Readings above 50 indicate expansion, and readings below 50 indicate contraction. For the past three months, it has been in the expansion phase.
Industrial Production: Contribution
%, indexed at 0.0 on January 2022
Data current as of: March 21, 2026
Source: Federal Reserve
Information is subject to change and is not a guarantee of future results.
Chart 6, 4:40– This is data from the monthly industrial production report. The report measures physical output (volume) for manufacturing, mining and utilities. This chart focuses only on manufacturing. The dark blue line measures the aggregate changes since 2022. You can see that, after a few years below zero, it has been trending upward since 2025. What has been causing that change in direction, you may ask.
Consider the growth of newer technologies and the areas where the United States excels. It is driven by growth in aerospace, batteries, semiconductors and computer equipment. Please note that the dip that you see in 2024 was when the Boeing employees were on a 53 day strike. So, with all that growth, why is the index still near zero?
Well, across the other manufacturing areas, on average, they have been a drag; you can see this in the light blue. What makes this chart more impressive is that the four sectors in positive territory account for less than 8% of total output. The other 92+% is dragging it down.
But we expect those four areas to continue to become a larger share of output and those sectors are where the United States excels.
This administration and the previous one have been focused on increasing the number of jobs in domestic manufacturing. They have used incentives and penalties, such as the Inflation Reduction Act of 2022, the CHIPS and Science Act of 2022, and, of course, tariffs, to promote bipartisan topics.
This is especially true for products deemed critical to national security, economic resilience, and energy independence.
The economy is in the early stages of this reindustrialization. The growth is focused on areas including advanced technology, clean energy, components such as batteries and solar, semiconductors, and, of course, defense-related equipment. We expect those sectors will continue to grow due to very strong tailwinds as advances from artificial intelligence will be very impactful.
Important Information
The views expressed represent the opinions of RBC Rochdale, LLC which are subject to change and are not intended as a forecast or guarantee of future results. Stated information is provided for informational purposes only, and should not be perceived as personalized investment, financial, legal or tax advice or a recommendation for any security. It is derived from proprietary and non-proprietary sources which have not been independently verified for accuracy or completeness. While RBC Rochdale believes the information to be accurate and reliable, we do not claim or have responsibility for its completeness, accuracy, or reliability. Statements of future expectations, estimates, projections, and other forward-looking statements are based on available information and management's view as of the time of these statements. Accordingly, such statements are inherently speculative as they are based-on assumptions which may involve known and unknown risks and uncertainties. Actual results, performance or events may differ materially from those expressed or implied in such statements.
All investment strategies have the potential for profit or loss; changes in investment strategies, contributions or withdrawals may materially alter the performance and results of a portfolio. Different types of investments involve varying degrees of risk, and there can be no assurance that any specific investment will be suitable or profitable for a client's investment portfolio.
RBC Rochdale, LLC is an SEC-registered investment adviser and wholly-owned subsidiary of City National Bank. Registration as an investment adviser does not imply any level of skill or expertise. City National Bank is a subsidiary of the Royal Bank of Canada.
© 2026 RBC Rochdale, LLC. All rights reserved.
Put our insights to work for you.
If you have a client with more than $1 million in investable assets and want to find out about the benefits of our intelligently personalized portfolio management, speak with an investment consultant near you today.
If you’re a high-net-worth client who's interested in adding an experienced investment manager to your financial team, learn more about working with us here.
