
-
Economic Perspectives
The U.S. Economy is in a Sweet Spot
December 2023

- Filename
- Economic Perspectives DECEMBER 2023.pdf
- Format
- application/pdf
TRANSCRIPT
With the year-end in sight, we thought it might be a good idea just to take a step back and see how the U.S. economy has responded to all of the impact that we have seen from the Federal Reserve Bank, and also changes in fiscal policy from the federal government. From there, we can sort of set the path of what it will look like in 2024.
You may remember at the beginning of the year, most Wall Street firms were expecting the economy to go into a recession probably in the first half of the year, but, in fact, it didn't turn out to be that case. What ended up happening is that the number of people being hired was a little bit stronger, mainly because more people were coming into the labor force. This helped give more income that provided the money for strong consumer spending, and that pretty much drove economic growth, both in the first quarter and the second quarter. But in the third quarter, it was remarkable in terms of the amount of spending that went on. Consumers spent an awful lot of money, and that helped propel GDP growth in the third quarter to 5.2% – a very, very strong number.
As the fourth quarter has opened up, and we're starting to see some of the data, we're seeing that consumers are starting to slow down the pace of spending.
This is a result of a number of reasons: One, job growth isn't as strong as it had been earlier in the year. Two, wage growth is not nearly as strong as what we've seen in the recent past. And third, the amount of excess savings from the pandemic seems to be dwindling down, and there's not that money to spend.
So, a much slower pace of economic growth and inflation coming down substantially over the course of the year is really setting up an economy that the Fed wants. That's exactly what they want to see – it's what they call a "soft landing".
In today's presentation, I have a series of charts that show a number of the important economic indicators that we've seen and how they perform since 2021. There's a vertical line in each one of the charts that shows when the Fed started to raise the federal funds rate, and I have a dash line that shows what the average was of that indicator for the five years before the pandemic, something that we're viewing as relatively normal. This way, we can see how the Fed has progressed, what successes it has, and what it needs to do to help bring inflation back down to the target rate of 2%, have it maintain that level, so that the Fed can start lowering interest rates in 2024.
Chart 1: 2:46 – This chart is measuring inflation, in this case, we're looking at the yearly change in CPI, and it fell from a peak of 9.1% last summer to the current level of just 3.2%. A sharp change in inflation in such a short-period of time is a very, very rare event, and this next chart puts it in perspective.
Consumer Price Index
%, seasonally adjusted annual rate
Data current as of December 8, 2023
Source: Bureau of Labor Statistics
Information is subject to change and is not a guarantee of future results.
Chart 2: 3:10 – This chart is measuring the yearly change in percentage points of inflation, whether it's gone up or it has gone down, and you can see, over on the very far right-hand side, the most extreme that we had was, again, this past summer when it went from 9.1% in June of 2022 to just 3% in June of 2023. Looking at the dotted line, you can see that this is a rare event. The last time this happened, to see such an extreme move without a recession was in the early 1950’s, and that's a result of the high inflation that it had just beforehand, which was sort of a result of the shortages from the Korean War that got corrected and that helped push down inflation.
CPI: 12-month change in the Annual Rate
% change, seasonally adjusted
Data current as of December 8, 2023
Source: Bureau of Labor Statistics
Information is subject to change and is not a guarantee of future results.
The only other time that we saw something more extreme was a little more than a decade ago during the housing financial crisis, or the global financial crisis, as it's known throughout the rest of the world. In this case, oil prices plummeted. In July of 2008, they were $145 a barrel. By December, it had fallen to below $35 a barrel, and that was the driving force of inflation back then.
Chart 3: 4:22 – So, with inflation coming down so much, the other issue that the Fed focuses on, of course, is the labor market, and this is quite remarkable.
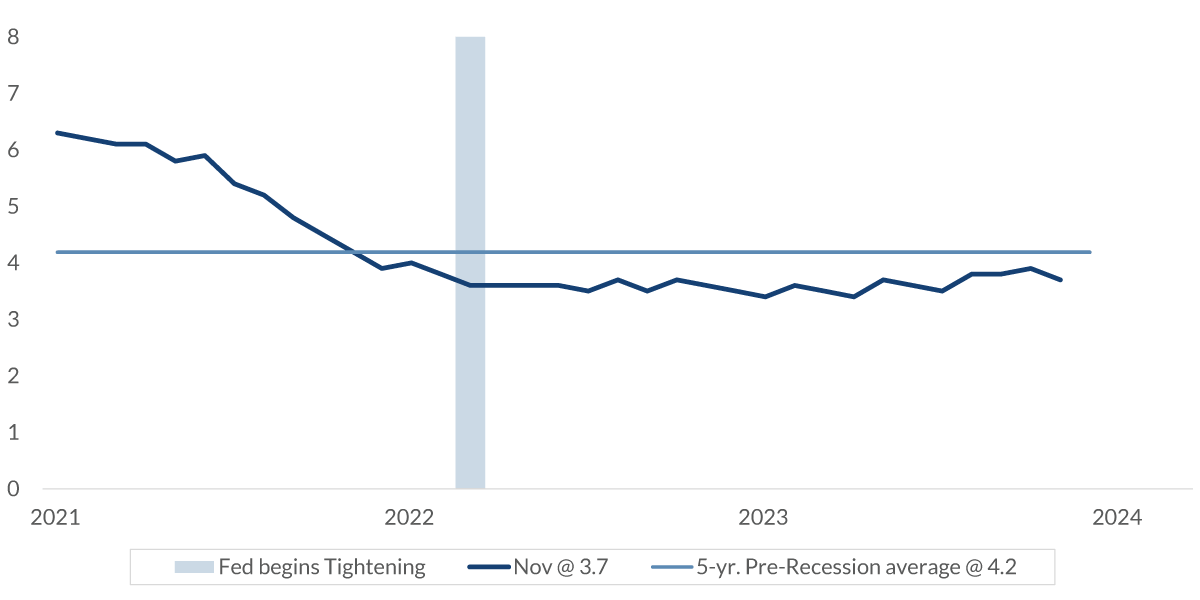
For such a sharp decline in inflation, we really haven't seen much of a change in the unemployment rate, which is rare. Normally, when inflation falls, the unemployment rate moves up significantly, but the unemployment rate currently stands at 3.7%. That's only up three tenths of a percentage point from the low of January of this year, and it's still well below what we had seen during the five years before the pandemic. So, this is providing the Fed with the soft landing that they want.
Unemployment Rate
%, seasonally adjusted
Data current as of December 8, 2023
Source: Bureau of Labor Statistics
Information is subject to change and is not a guarantee of future results.
Inflationary pressures are retreating, and there hasn't been much of a change in the unemployment rate. More important is the fact that nonfarm payroll (a separate measurement of the labor force) has shown that there hasn't been a month with declines. This is mainly because we see more people coming into the labor force.
Chart 4: 5:21 – Now we need to explore the inflation issue a little bit more, in greater detail.
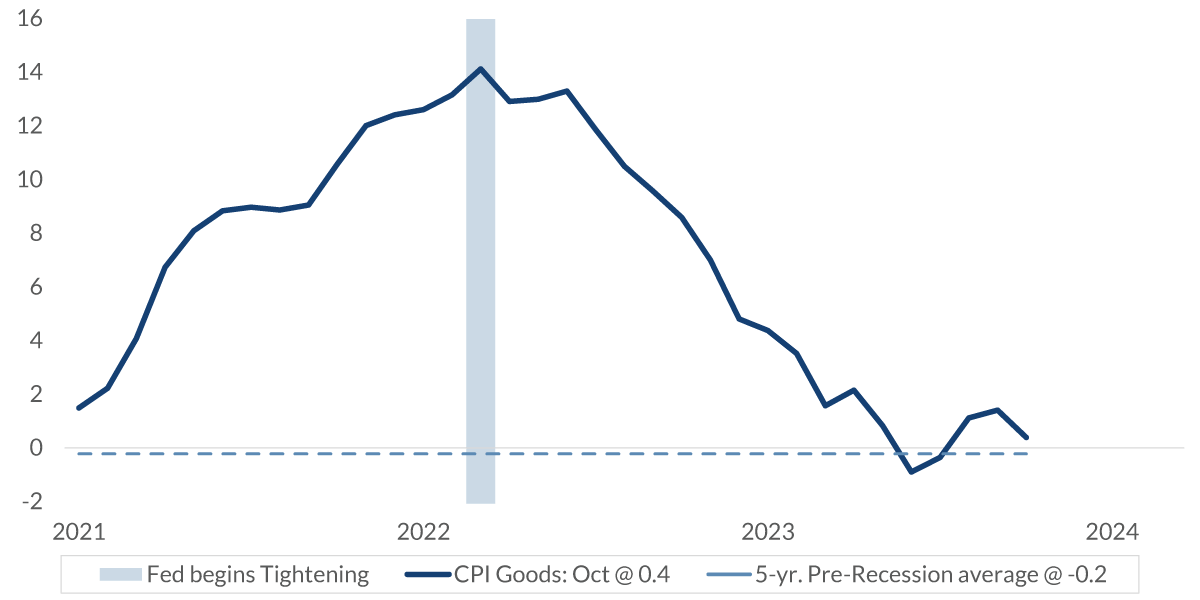
Here, we're going to break down inflation into the two major categories: what one pays for goods, and what one pays for services.
The first chart here is just showing the price of goods, and you can see that peak, during the pandemic period at 14.1% year-over-year, and that was mainly a result of consumers wanting to buy an awful lot of goods at a time that those goods were limited either in terms of the amount that was being produced or the amount that was able to get shipped into the United States and then distributed around the country.
CPI: Goods
% change y-o-y, seasonally adjusted
Data current as of December 8, 2023
Source: Bureau of Labor Statistics
Information is subject to change and is not a guarantee of future results.
But in the last few years, that has corrected itself. An awful lot of those logistic problems have been resolved, and the demand for an awful lot of those goods has fallen. As a result, you can see that goods inflation is just four tenths of a percent – pretty close to what it averaged for the five years before the pandemic.
Chart 5: 6:19 – It's this next chart that's a concern for the Fed –this is for the service portion of CPI, which makes up about two thirds of CPI. Yes, you can see on this chart, it is declining on a year over year basis, but it's still a long way away from what we saw before the pandemic.
CPI: Services
% change y-o-y, seasonally adjusted
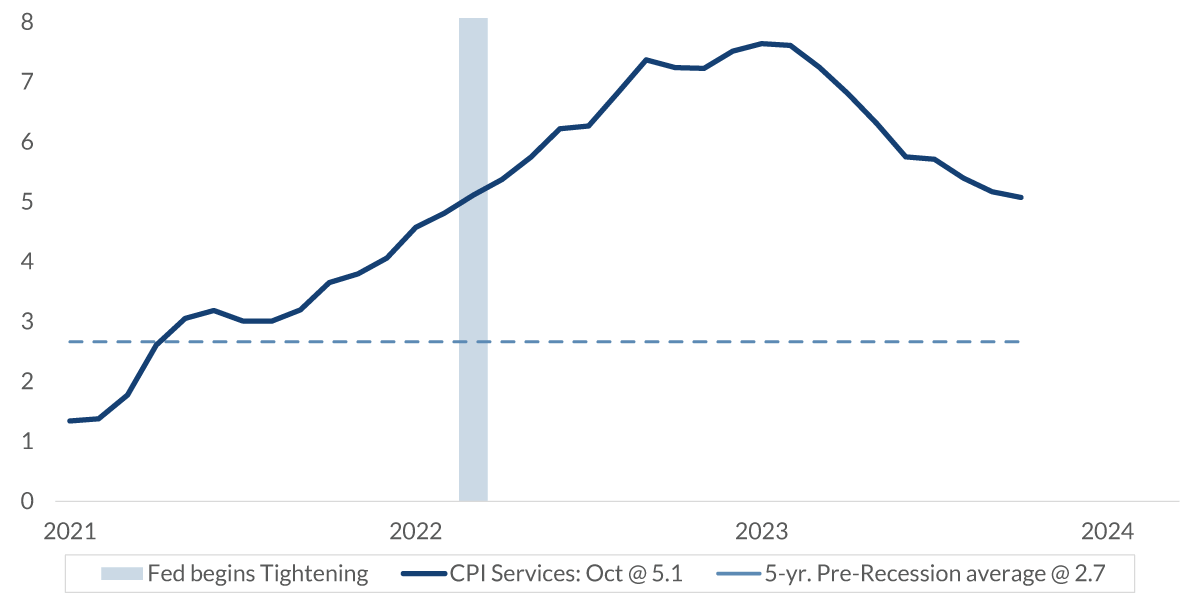
Data current as of December 8, 2023
Source: Bureau of Labor Statistics
Information is subject to change and is not a guarantee of future results.
Chart 6: 6:38 – The biggest component of service inflation is shelter or housing costs. And this chart here is showing the year-over-year change in shelter costs. It's a broad term that's used for most housing costs that our consumers have to deal with. Again, you can see it's declining, but it's doing so at a very, very slow pace. It's retreated just about one and a half percentage points from the high and stands at 6.7%, which is about twice the average it was before the pandemic.
CPI: Shelter
% change y-o-y, seasonally adjusted
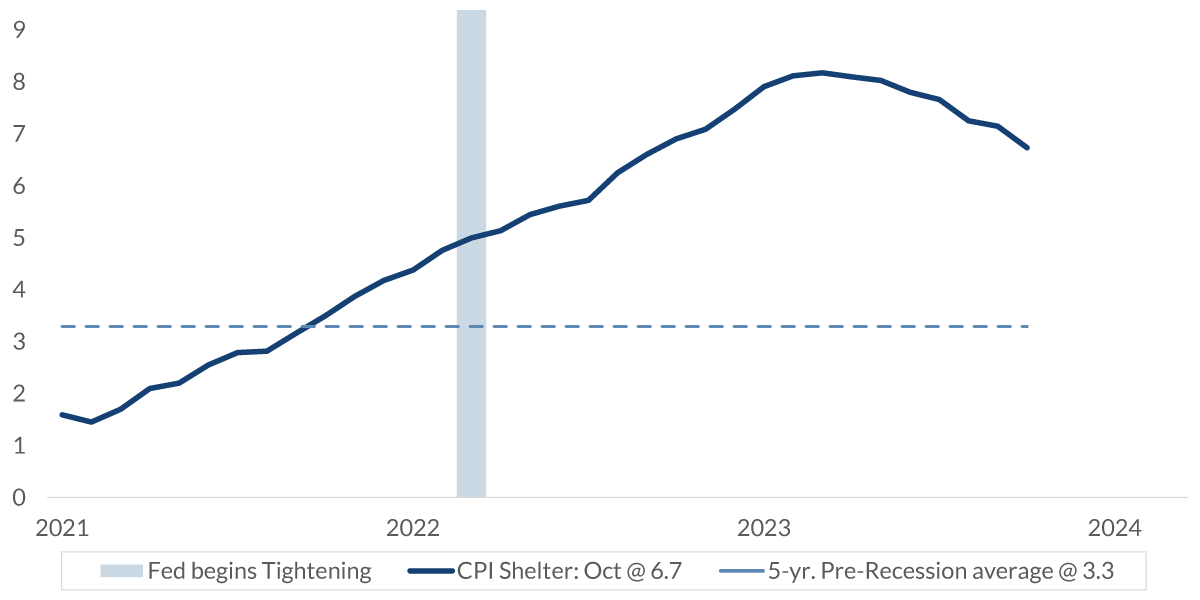
Data current as of December 8, 2023
Source: Bureau of Labor Statistics
Information is subject to change and is not a guarantee of future results.
This is a concern for the Fed, and this is part of why we believe the Fed has to keep interest rates higher for longer because this part of inflation still has a ways to retreat before the Fed's going to be comfortable in its goal of 2% inflation.
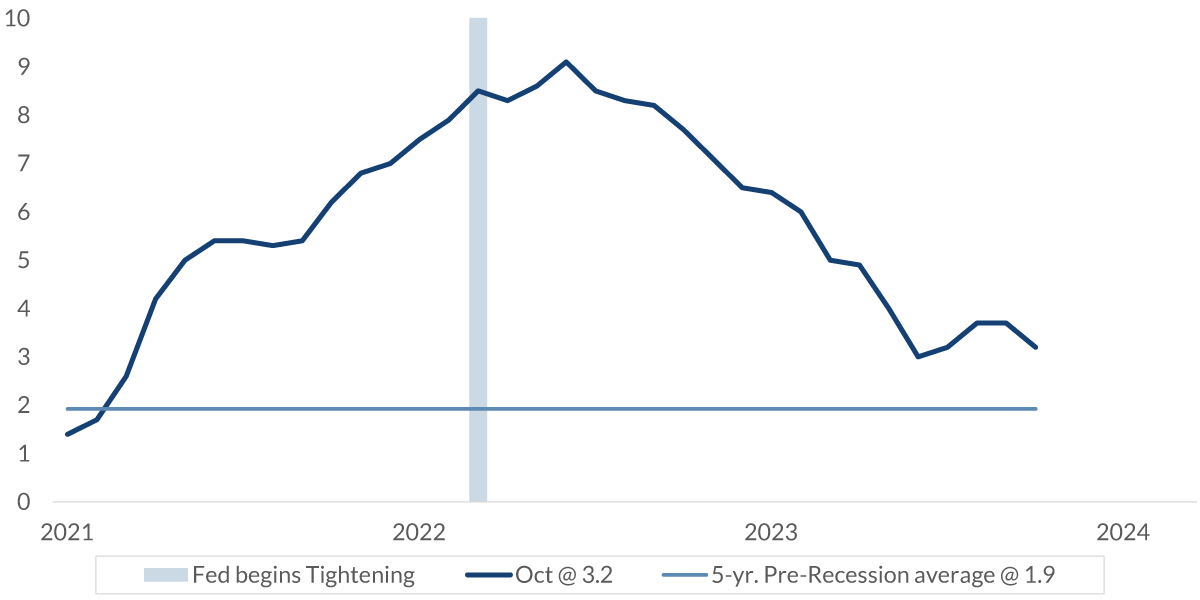
Chart 7: 7:25 – In this chart here, we're taking a look at wage growth. Again, it's retreating from the highs but it's not near what we had seen beforehand. And this is a concern for the Fed because wage growth feeds very quickly into the cost of an awful lot of services, and it's helping to keep those service prices elevated, again, a concern for the Fed.
Wage Growth Tracker: Median Wage
%, seasonally adjusted annual rate
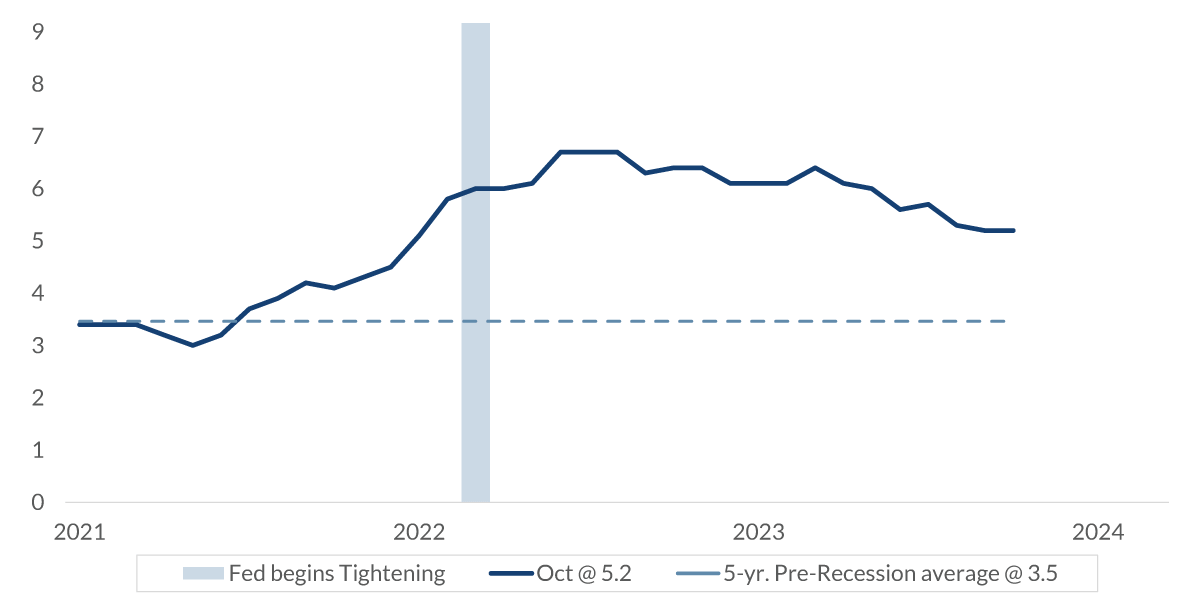
Data current as of December 8, 2023
Source: Bureau of Labor Statistics
Information is subject to change and is not a guarantee of future results.
Summary: 7:47 – So, with the major sections of the economy all moderating toward a level that the Fed will probably find acceptable and believe that inflation will be able to be at that 2% and sustainable there, the Fed will soon see that they'll be able to cut interest rates. That said, we don't think it will happen until the second half of 2024.
The decline in inflation will be much slower going forward than it has been in the past year, and so the Fed will have to take its time before they feel comfortable in lowering interest rates.
Important Information
The information presented does not involve the rendering of personalized investment, financial, legal, or tax advice. This presentation is not an offer to buy or sell, or a solicitation of any offer to buy or sell any of the securities mentioned herein.
Certain statements contained herein may constitute projections, forecasts and other forward-looking statements, which do not reflect actual results and are based primarily upon a hypothetical set of assumptions applied to certain historical financial information. Viewers are cautioned that such forward-looking statements are not a guarantee of future results, involve risks and uncertainties, and actual results may differ materially from those statements. Certain information has been provided by third-party sources and, although believed to be reliable, it has not been independently verified and its accuracy or completeness cannot be guaranteed.
Any opinions, projections, forecasts, and forward-looking statements presented herein are valid as of the date of this video’s distribution and are subject to change.
Past performance or performance based upon assumptions is no guarantee of future results.
All investing is subject to risk, including the possible loss of the money you invest. As with any investment strategy, there is no guarantee that investment objectives will be met and investors may lose money. Diversification does not ensure a profit or protect against a loss in a declining market.
City National Rochdale, LLC, is a SEC-registered investment adviser and wholly owned subsidiary of City National Bank. Registration as an investment adviser does not imply any level of skill or expertise. City National Bank and City National Rochdale are subsidiaries of Royal Bank of Canada.
