February 2024 Market Update
A Deep Dive into CNR’s Economic and Investment Outlook
February 29, 2024

February 29, 2024
Soft Landing Probability Increased for 2024
The probability of a soft landing for the economy is now at 60%, according to our leadership team at City National Rochdale. A moderation in economic growth and the gradual cooling of inflation are expected to continue, allowing the Fed to lower interest rates two or three times in 2024 beginning in the second half of the year. But even as consumer spending is expected to slow, household wealth, income gains and the strength in the labor market are likely to offset that trend helping the economy avoid recession.
We expect modest returns across asset classes in 2024 and remain focused on investing in high quality stocks and bonds. Potential rate cuts in the second half of the year indicate that now is the time to opportunistically take advantage of higher interest rates.
Source: Proprietary opinions based on CNR Research, as of February 2024.
Information is subject to change and is not a guarantee of future results.
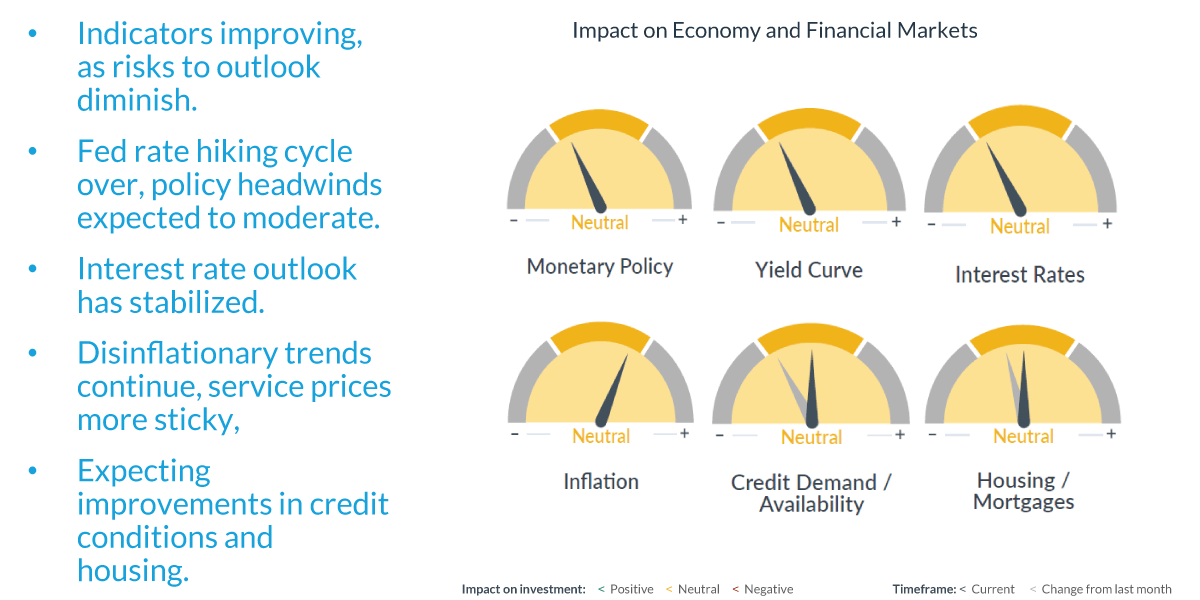
This information has been updated and is highlighted in the latest Speedometers video, located here: https://www.cnr.com/insights/speedometers.html
Several of our Speedometers®, which are forward-looking economic indicators of six to nine months, are in yellow territory and gradually moving toward green. Recent housing data indicates pent-up demand for housing. In addition, monetary policy, the yield curve and interest rates are no longer flashing red, indicating their expected impact on the economy has improved. We also expect continued improvement in inflation and credit availability over the course of the year.
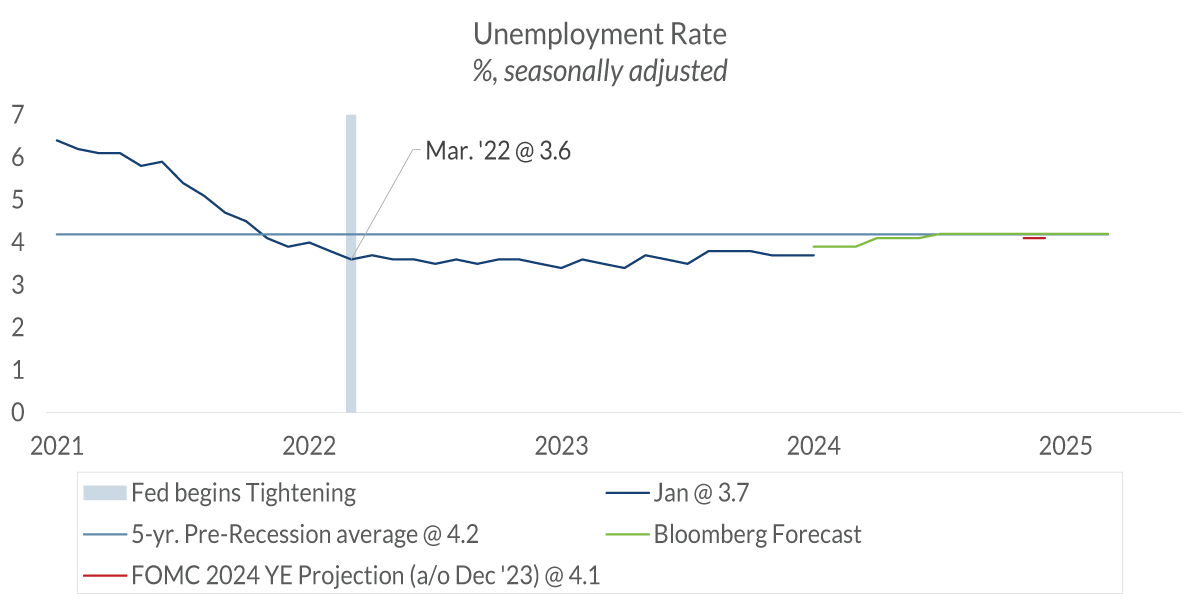
Data current as of February 28, 2024 Source: Bureau of Labor Statistics, Federal Reserve, Bloomberg Composite of Economic Forecasts Information is subject to change and is not a guarantee of future results.
After raising the federal funds rate by 525 bps, the Fed appears on track to achieve a soft landing. A particular strength in the economy is the labor market. Unemployment has been below 4% for 24 consecutive months, a trend that hasn’t been seen since the 1960s. Inflation has declined, while the unemployment rate has increased by just 1/10 of a percentage point.
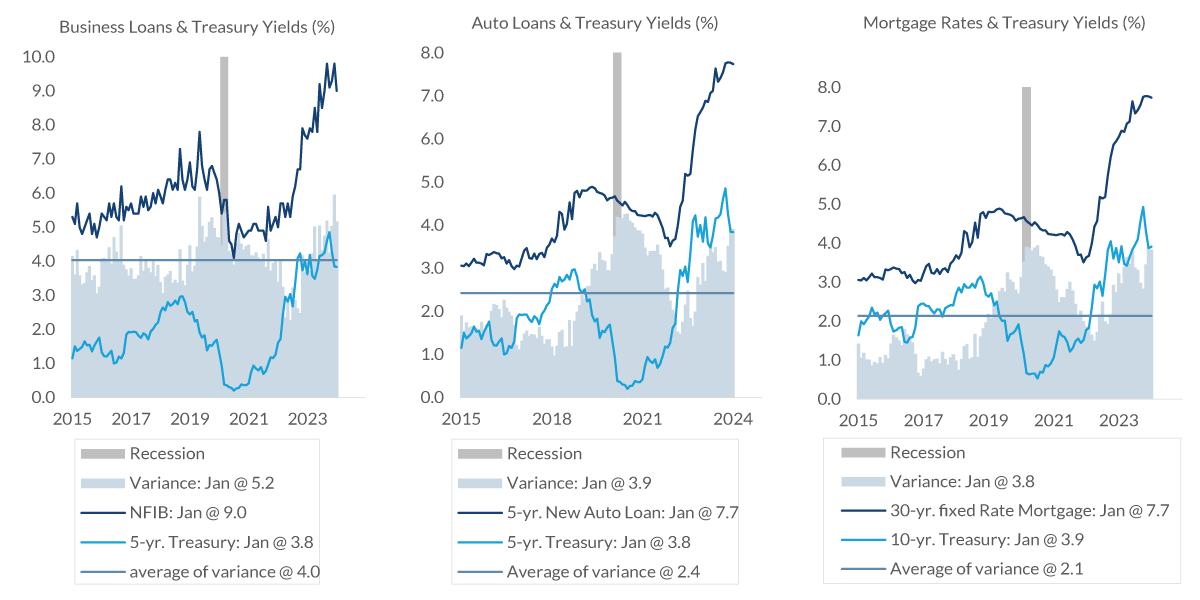
Data current as of February 28, 2024 Source: National Federation of Independent Businesses, Bankrate.com, Bloomberg Information is subject to change and is not a guarantee of future results.
A headwind for the economy for the next few quarters is likely to be the lingering impact of higher borrowing costs. While it’s part of the Fed strategy to increase the cost of credit to slow economic growth, the variance between interest rates and loan rates is wider than the long-term average. This is likely to slow consumption until credit costs come down.
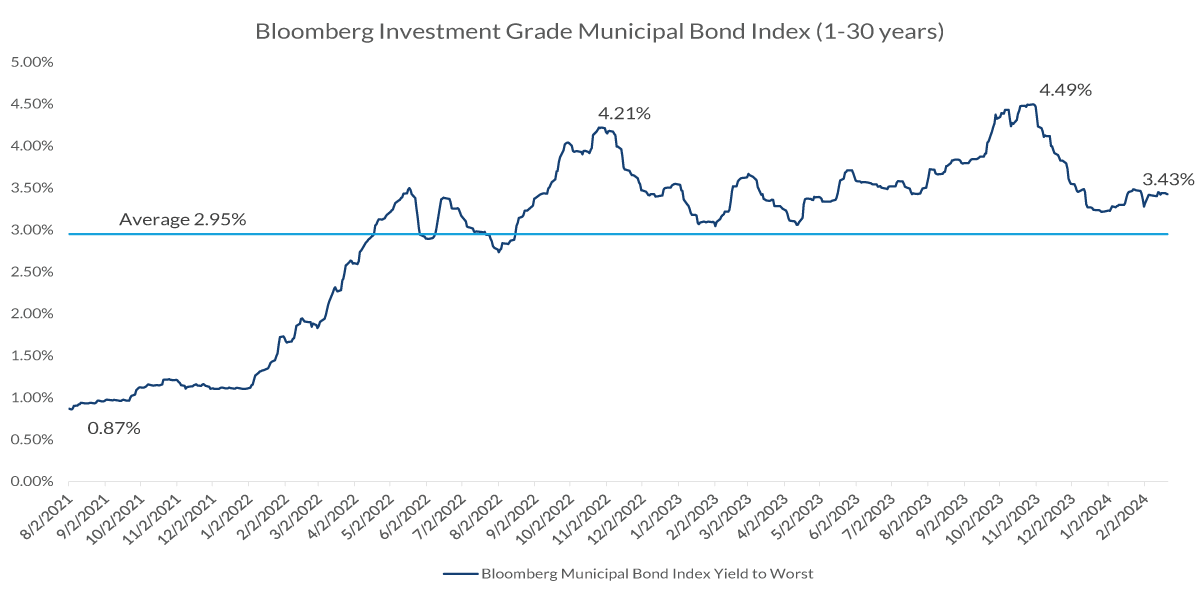
Sources: Bloomberg Municipal Bond Index, Taxable equivalent yield assumes 37% Federal Tax Bracket and 3.8% Medicare surcharge, as of 2/21/2024. Information is subject to change and is not a guarantee of future results.
Despite a pullback over the past few months from multi-decade highs, municipal bonds are still offering historically attractive yields. We use the Bloomberg Investment Grade Municipal Bond Index to visualize yields across the spectrum, which has maturities of one to 30 years. The current tax-exempt yield of 3.43% equals a taxable yield of 5.79% or as much as 7% for investors in high tax states like New York and California.
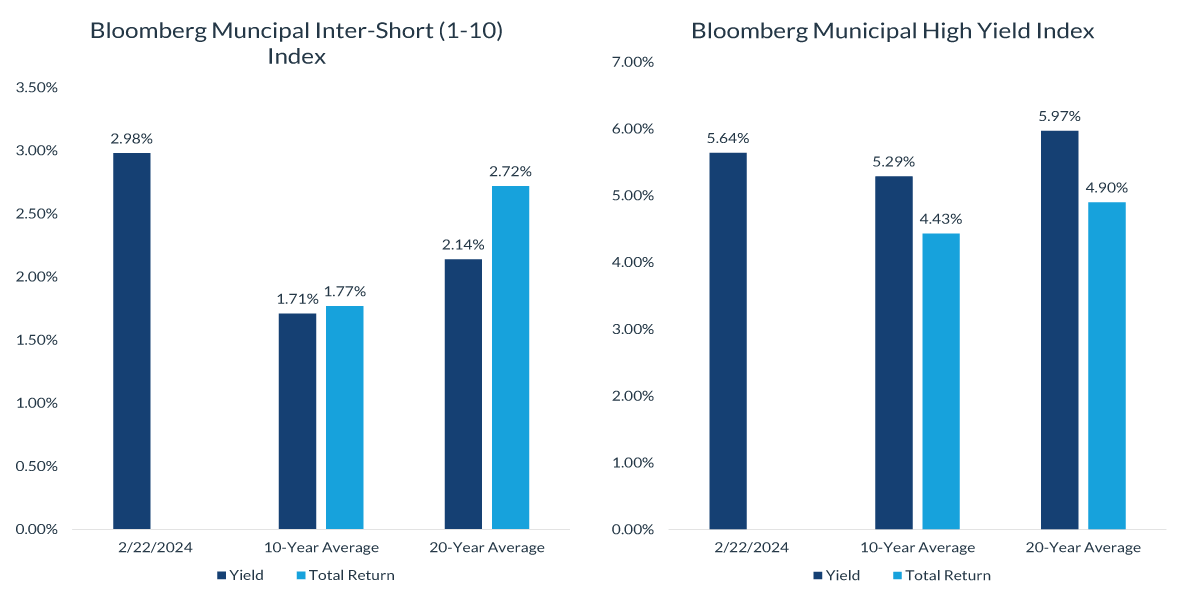
Source: Bloomberg Municipal Inter-Short (1-10 Index) and Bloomberg Municipal High Yield Index, as of 2/22/2024. Information is subject to change and is not a guarantee of future results.
When comparing the Bloomberg Intermediate to Short-term Index with the Bloomberg High Yield Index, it’s clear that tax-exempt yields are currently attractive compared to long-term yields. Since long-term returns rely heavily on starting yields, investors may want to look into the opportunities now.
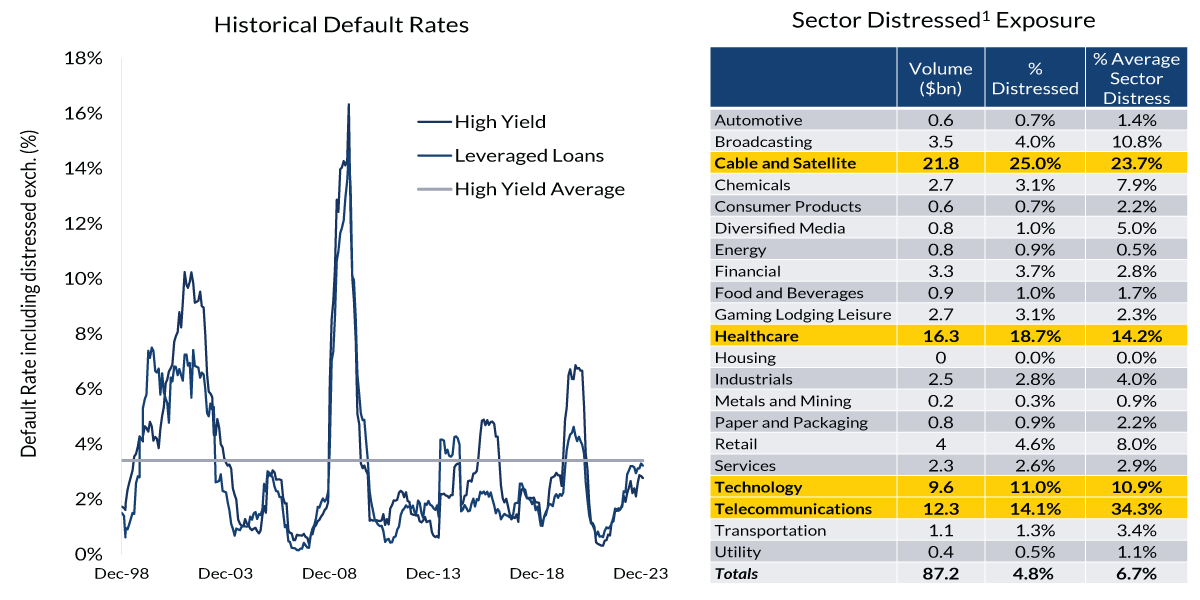
1 Distressed securities are defined as those with prices below $70. Sources: JP Morgan, CNR Research. Historical Default Rates Chart as of 1/31/2024; Sector Distressed Exposure as of 2/9/2024. See index definitions for more information. Information is subject to change and is not a guarantee of future results.
While there’s been concern expressed about the “maturity wall,” just $40 billion in corporate debt matures in 2024, much of which may be refinanced. Another concern has been corporate default rates, which rose to slightly below the 20-year average from a low base in 2020. But defaults are heavily concentrated in just four sectors: healthcare, telecom, technology and cable and satellite industries. Our portfolios are well positioned and don’t own any companies that are prone to default.
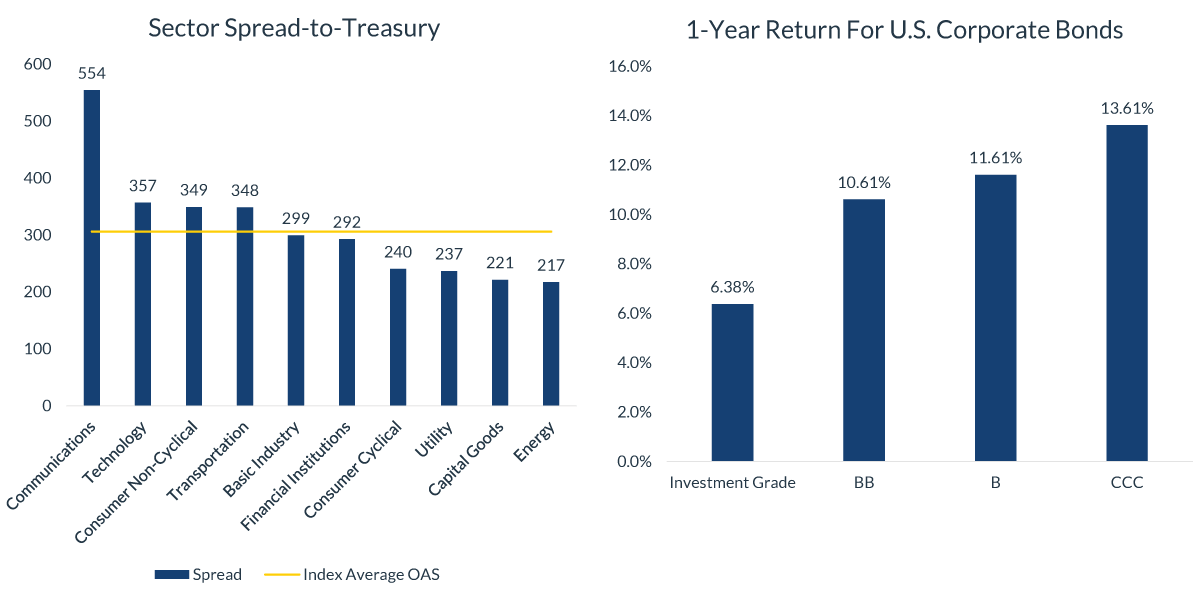
Source: JP Morgan, Bloomberg, CNR Research, as of February 2024. Information is subject to change and is not a guarantee of future results.
The spread dispersion across various high yield sectors has risen, creating various opportunities between individual positions. While there’s been chatter about the higher returns on CCC bonds, we’re 80% invested in BB bonds with a return of 11% over the past 12 months. In our view, the 3% in additional yields is not worth the credit risk of those lower quality securities. We prefer higher quality debt in the BB range given the absolute level of yields.
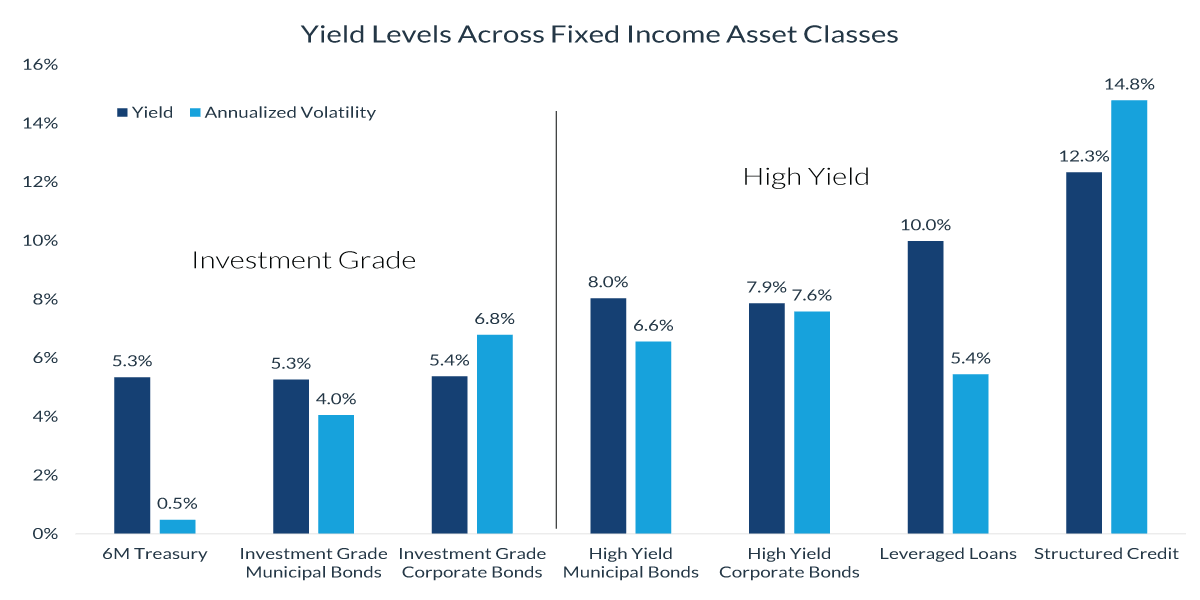
* Assumes the highest marginal federal tax rate of 37%, plus the 3.8% Medicare surcharge
**Volatility is standard deviation calculated on monthly total returns from 1/31/2014 to 1/31/2024
Source: Bloomberg, CNR Research. Information is subject to change and is not a guarantee of future results.
We remain optimistic and excited about fixed income investing. Fixed income yield levels have increased significantly over the past several years and still offer some of the best risk-adjusted returns in decades. While underlying yield volatility has risen, higher yield levels reduce volatility over the long term.
Source: CNR Research, January 2024. Past performance is no guarantee of future results. Information is subject to change and is not a guarantee of future results.
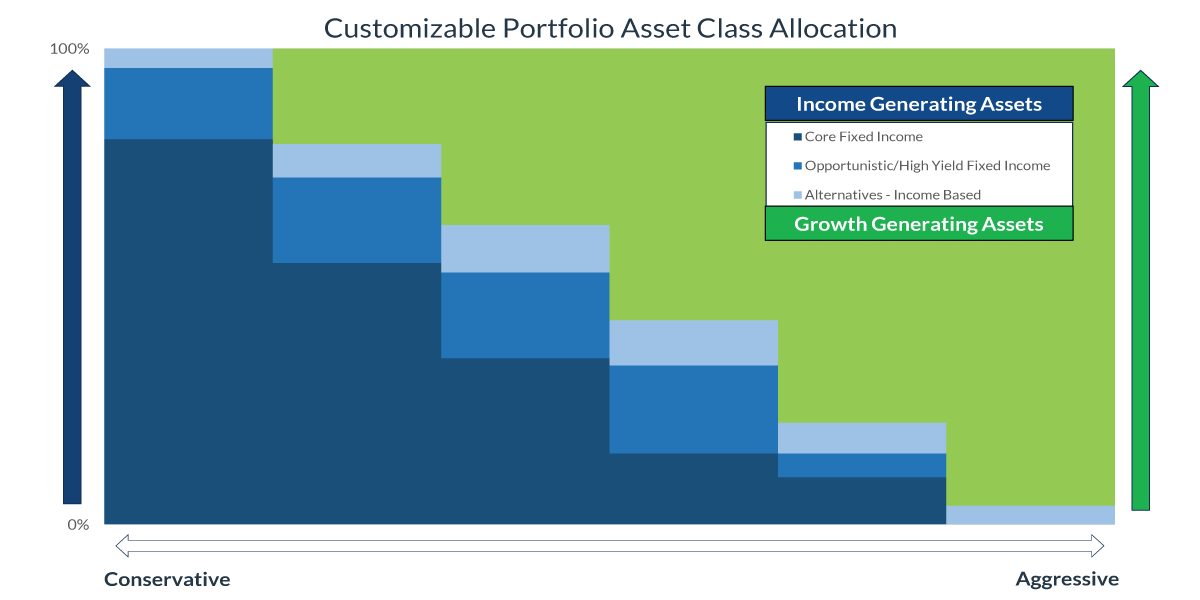
To meet client goals for growth, income and capital preservation, CNR portfolios can be balanced between income generating assets and growth assets. On the income side, further risk-adjusted customization can be achieved by considering core fixed income, opportunistic high yield income and alternative income-based investments.
Fixed income has multiple roles to play in portfolios. Some of the key benefits include: contributing to cash flow, optimizing for after-tax cash flow, capital preservation and inflation mitigation. Most importantly, fixed income can increase the probability of successfully achieving client goals with predictable income and reduced volatility.
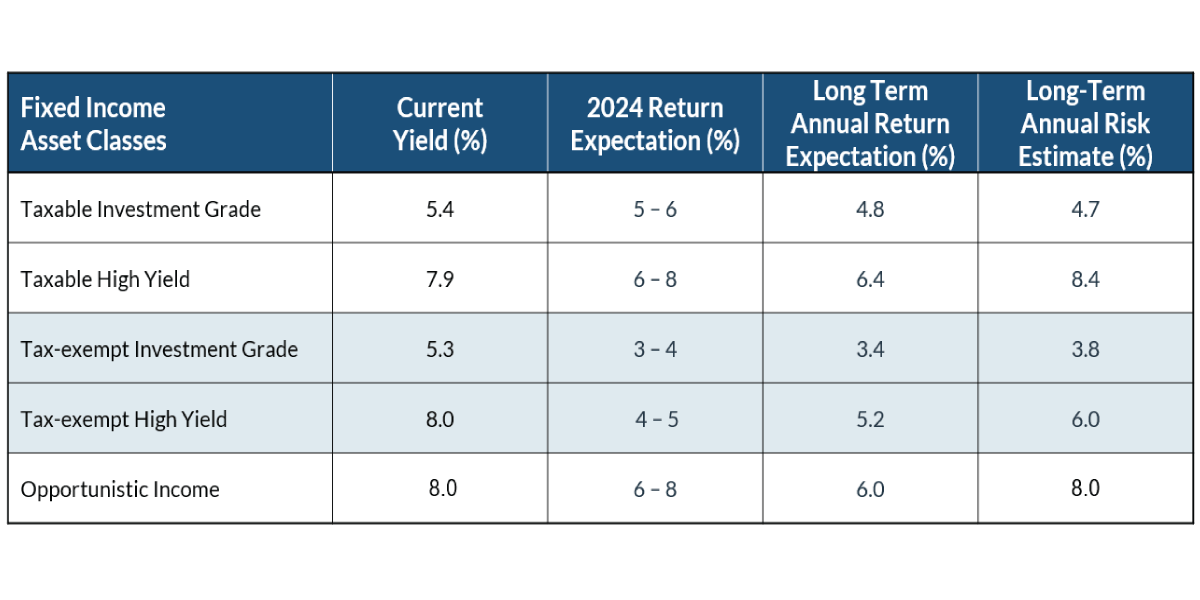
Source: CNR Research, January 2024. *Before tax returns. Information is subject to change and is not a guarantee of future results. Expected returns shown represent CNR’s forecast of each respective asset class based on market indices, and not for any CNR products for services. There is no assurances that any of the expected returns may be realized, and actual returns may be lower given market conditions. CNR actual strategy returns in these asset classes may be considerably lower. Expected returns shown represent CNR’s forecast of each respective asset class based on market indices, and not for any CNR products for services. There is no assurances that any of the expected returns may be realized, and actual returns may be lower given market conditions. CNR actual strategy returns in these asset classes may be considerably lower. Current 5-year Yield to Worst (YTW) is used to estimate near-term expectations for Core Fixed Income, the fixed income segments of Opportunistic Income, and Inflation Protected Fixed Income. Near-term return expectation indicates a 12- to 24-month view. Equities: S&P 500, S&P 1000, DJ Select Dividend; Core Fixed Income/Cash: MSCI EAFE, MSCI EM, Bloomberg Intermediate Government (LUGITRUU), Bloomberg Intermediate Corporate (LD06TRUU), Bloomberg Municipal Bond Index (LMBITR); Opportunistic Income: Bloomberg Global Aggregate (LEGATRUU), Bloomberg Global HY (LG30TRUU), S&P/LSTA U.S. Leveraged Loan Index (SPBDAL), S&P Preferred Index (SPPREF), Bloomberg US Corporate HY (LF98TRUU), Bloomberg High Yield Municipal (I05669US), Swiss Cat Bond (SRCATTRR); Alternative Investments: Palmer Square CLO BB (PCLOBBTR), Cambridge Associates LLC U.S. Private Equity Index, Dow Jones US Real Estate (DJUSRET), Cliffwater Direct Lending Index (CDLI); Real Assets: Bloomberg Commodity Index (BCOM), Dow Jones Precious Metals Index (DJGSP), Bloomberg US TIPs Index (LBUTTRUU). Information is subject to change and is not a guarantee of future results. This is not representative of the future performance of any CNR product or service.
Top takeaways for fixed income investing include:
· The downward glide path for inflation serves as a tailwind for fixed income.
· Positive economic outlook minimizes credit risk.
· We’re optimistic about fixed returns and see plenty of opportunities.
· Our portfolios are appropriately positioned to take advantage of additional opportunities.
· Active management of portfolios is expected to be increasingly important as everyone navigates the anticipated changes in Fed policy.
Review Your Portfolio with Your Financial Advisor Today
City National Rochdale encourages you to review your investment portfolio with your advisor. Contact our financial professionals today to get help with your wealth planning needs.
Important Information
Equity investing strategies & products.There are inherent risks with equity investing. These risks include, but are not limited to stock market, manager or investment style. Stock markets tend to move in cycles, with periods of rising prices and periods of falling prices.
Fixed Income investing strategies & products.There are inherent risks with fixed income investing. These risks include, but are not limited to, interest rate, call, credit, market, inflation, government policy, liquidity or junk bond risks. When interest rates rise, bond prices fall.This risk is heightened with investments in longer-duration fixed income securities and during periods when prevailing interest rates are low or negative.
Investing in international markets.There are inherent risks with international investing. These risks include, but are not limited to, risks such as currency fluctuation, regulatory risks, and economic and political instability. Emerging markets involve heightened risks related to the same factors, as well as increased volatility, lower trading volume and less liquidity. In addition, emerging markets can have greater custodial and operational risks and less developed legal and accounting systems than developed markets. Investments in emerging markets bonds may be substantially more volatile, and substantially less liquid, than the bonds of governments, government agencies, and government-owned corporations located in moredeveloped foreign markets.
High yield securities.Investments in below-investment-grade debt securities, which are usually called “high yield” or “junk bonds,” are typically in weaker financial health. Such securities can be harder to value and sell, and their prices can be more volatile than more highly rated securities. While these securities generally have higher rates of interest, they also involve greater risk of default than do securities of a higher-quality rating.
Real estate sector or REITs.Concentrating assets in the real estate sector or REITs may disproportionately subject a portfolio to the risks of that industry, including the loss of value because of adverse developments affecting the real estate industry and real property values. Investments in REITs may be subject to increased price volatility and liquidity risk; concentration risk is high.
Municipal securities. The yields and market values of municipal securities may be more affected by changes in tax rates and policies than similar income-bearing taxable securities. Certain investors' incomes may be subject to the Federal Alternative Minimum Tax (AMT), and taxable gains are also possible.
Investments in the municipal securities of a particular state or territory may be subject to the risk that changes in the economic conditions of that state or territory will negatively impact performance. These events may include severe financial difficulties and continued budget deficits, economic or political policy changes, tax base erosion, state constitutional limits on tax increases and changes in the credit ratings.
All investment strategies have the potential for profit or loss; changes in investment strategies, contributions or withdrawals may materially alter the performance and results of a portfolio. Different types of investments involve varying degrees of risk, and there can be no assurance that any specific investment will be suitable or profitable for a client's investment portfolio.
The views expressed represent the opinions of City National Rochdale, LLC (CNR) which are subject to change and are not intended as a forecast or guarantee of future results. Stated information is provided for informational purposes only, and should not be perceived as personalized investment, financial, legal or tax advice or a recommendation for any security. It is derived from proprietary and non-proprietary sources which have not been independently verified for accuracy or completeness. While CNR believes the information to be accurate and reliable, we do not claim or have responsibility for its completeness, accuracy, or reliability. Statements of future expectations, estimates, projections, and other forward-looking statements are based on available information and management's view as of the time of these statements. Accordingly, such statements are inherently speculative as they are based-on assumptions which may involve known and unknown risks and uncertainties. Actual results, performance or events may differ materially from those expressed or implied in such statements.
All investing is subject to risk, including the possible loss of the money you invest. As with any investment strategy, there is no guarantee that investment objectives will be met and investors may lose money. Diversification does not ensure a profit or protect against a loss in a declining market. Past performance is no guarantee of future performance.
City National Rochdale, LLC, is a SEC-registered investment adviser and wholly owned subsidiary of City National Bank. Registration as an investment adviser does not imply any level of skill or expertise. City National Bank and City National Rochdale are subsidiaries of Royal Bank of Canada. City National Bank provides investment management services through its subadvisory relationship with City National Rochdale, LLC.
© 2024 City National Rochdale, LLC. All rights reserved.
Index Definitions
S&P 500 Index. The Standard & Poor’s 500 Index is a market capitalization-weighted index of 500 common stocks chosen for market size, liquidity, and industry group representation to represent US equity performance.
MSCI EAFE Index. The MSCI EAFE (Europe, Australasia, Far East) Index is a free float-adjusted market capitalization weighted index that is designed to measure developed equity market results, excluding the US and Canada.
The MSCI Emerging Markets Index. The MSCI Emerging Markets Index is a free float-adjusted market capitalization weighted index that is designed to measure equity market results in the global emerging markets, consisting of more than 20 emerging market country indexes.
US High Yield Index. The US High Yield Index is a market capitalization weighted index that measures the performance of U.S. dollar denominated below investment grade corporate debt publicly issued in the U.S. domestic market.
Emerging Market High Yield. The MSCI Emerging Markets Index is a selection of stocks that is designed to track the financial performance of key companies in fast-growing nations.
Bloomberg US Corporate High Yield Index. The Bloomberg US Corporate High Yield Index measures the performance of non-investment grade, US dollar-denominated, fixed-rate, taxable corporate bonds.
Bloomberg Municipal Bond Index. The Bloomberg US Municipal Bond Index measures the performance of investment grade, US dollar-denominated, long-term tax-exempt bonds.
Bloomberg Municipal High Yield Bond Index. The Bloomberg Municipal High Yield Bond Index measures the performance of non-investment grade, US dollar-denominated, and non-rated, tax-exempt bonds.
Bloomberg US Corporate 1-5 years Total Return Index Value Unhedged USD: The Bloomberg US Corporate Bond 1-5 Year Index measures the investment grade, fixed-rate, taxable corporate bond market with 1-5 year maturities.
Bloomberg US Investment Grade Corporate Bond Index: The Bloomberg US Corporate Bond Index measures the investment grade, fixed-rate, taxable corporate bond market. It includes USD denominated securities publicly issued by US and non-US industrial, utility and financial issuers.
DJ US Select Dividend Index®. The Dow Jones US Select Dividend Index® measures the performance of the top 100 US stocks by dividend yield.
Bloomberg US Aggregate Bond Index: The Bloomberg US Aggregate Bond Index measures the performance of investment grade, US dollar-denominated, fixed-rate taxable bonds.
Bloomberg U.S. High Yield Corporate Bond Index. The Bloomberg Barclays US Corporate High Yield Bond Index measures the USD-denominated, high yield, fixed-rate corporate bond market.
The Bloomberg Investment Grade Corporate Bond Index .The Bloomberg US Investment Grade Corporate Bond Index measures the performance of investment grade, corporate, fixed-rate bonds with maturities of one year or more.
Bloomberg Emerging Market High Yield Index. The Bloomberg Emerging Markets USD Aggregate Bond Index is a flagship hard currency Emerging Markets debt benchmark that includes fixed and floating-rate US dollar-denominated debt issued from sovereign, quasi-sovereign, and corporate EM issuers.
Alternatives – Income based performance: Returns illustrated are 50% Palmer Square BB CLO Index/50% Palmer Square BBB CLO Index.
Nasdaq. Nasdaq 100 Index is an index composed of the 100 largest, most actively traded U.S. companies listed on the Nasdaq stock exchange.
Indexes are unmanaged and do not reflect a deduction for fees or expenses. Investors cannot invest directly in an index.
Definitions
Commercial and Industrial (C&I) Loan A commercial and industrial (C&I) loan is a loan made to a business or corporation.
Gross Domestic Product (GDP) is the total monetary or market value of all the finished goods and services produced within a country’s borders in a specific time period.
The Consumer Price Index (CPI) measures the monthly change in prices paid by US consumers.
Yield to Worst (YTW) is the lower of the yield to maturity or the yield to call. It is essentially the lowest potential rate of return for a bond, excluding delinquency or default.
A leveraged loan is a type of loan that is extended to companies or individuals that already have considerable amounts of debt or poor credit history.
A collateralized loan obligation (CLO) is a single security backed by a pool of debt.
CITY NATIONAL ROCHDALE, LLC NON- DEPOSIT INVESTMENT PRODUCTS ARE: • NOT FDIC INSURED • NOT BANK GUARANTEED • MAY LOSE VALUE