June 2024 Mid Year Outlook
A Deep Dive into CNR’s Economic and Investment Outlook
June 27, 2024

June 27, 2024
Rate Cuts Ahead
The U.S. economy is slowing but remains resilient, according to our leadership team at City National Rochdale. Since our last market update in May, we have changed our inflation expectations by lowering the top end of our forecast range for year-end headline CPI to 2.75% to 3.25%, from 2.75% to 3.5%. Given the progress on inflation, we now anticipate the Federal Reserve will make one or possibly two rate cuts this year.
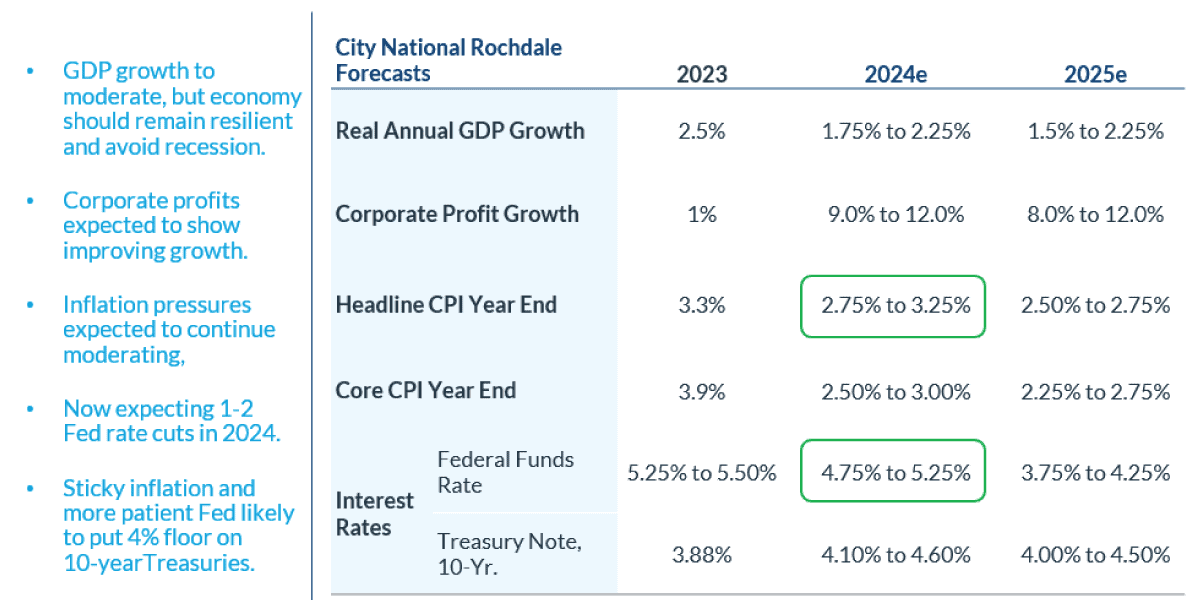
Gross domestic product (GDP) is the total monetary or market value of all the finished goods and services produced within a country’s borders in a specific time period.
The Consumer Price Index (CPI) measures the monthly change in prices paid by U.S. consumers.
e: estimate.
Sources: Bloomberg, proprietary opinions based on CNR Research, as of June 2024. Information is subject to change and is not a guarantee of future results.
The first half of 2024 has really been a tale of two trends in the economy. After a number of upside surprises from January through March, a stark reversal has occurred with the economic data. While we do not believe that the downward surprises seen recently are a significant worry for the outlook, we do think that they signal moderation ahead across a variety of economic measures.
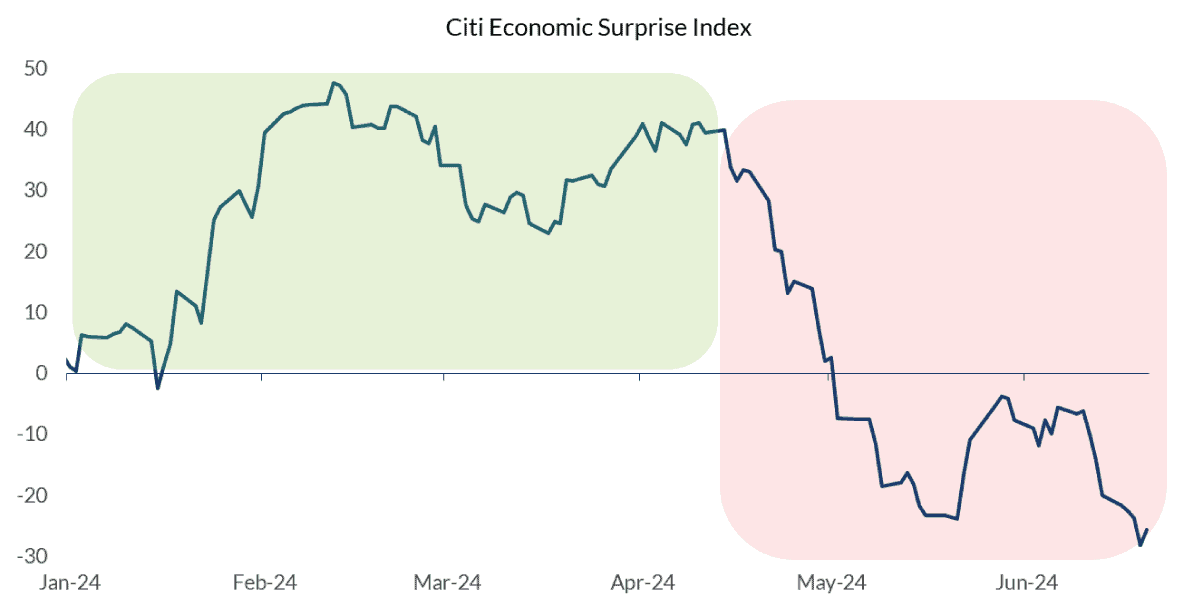
Source: Bloomberg, as of June 2024.
Information is subject to change and is not a guarantee of future results.
Over the second half of 2024, we expect many of the trends underway to continue. A slower pace of economic growth driven by cooling labor demand and a more budget-conscious consumer, but also a continued easing of inflation pressures that should finally pave the way for the Fed to begin its long-awaited easing cycle.
Since April, nearly all inflation indicators have resumed a gradual decline. This supports the thesis that the Fed will cut the federal funds rate at least once before the end of the year. Particularly encouraging news is that sticky core services inflation, excluding housing costs, has shown signs of moderating.
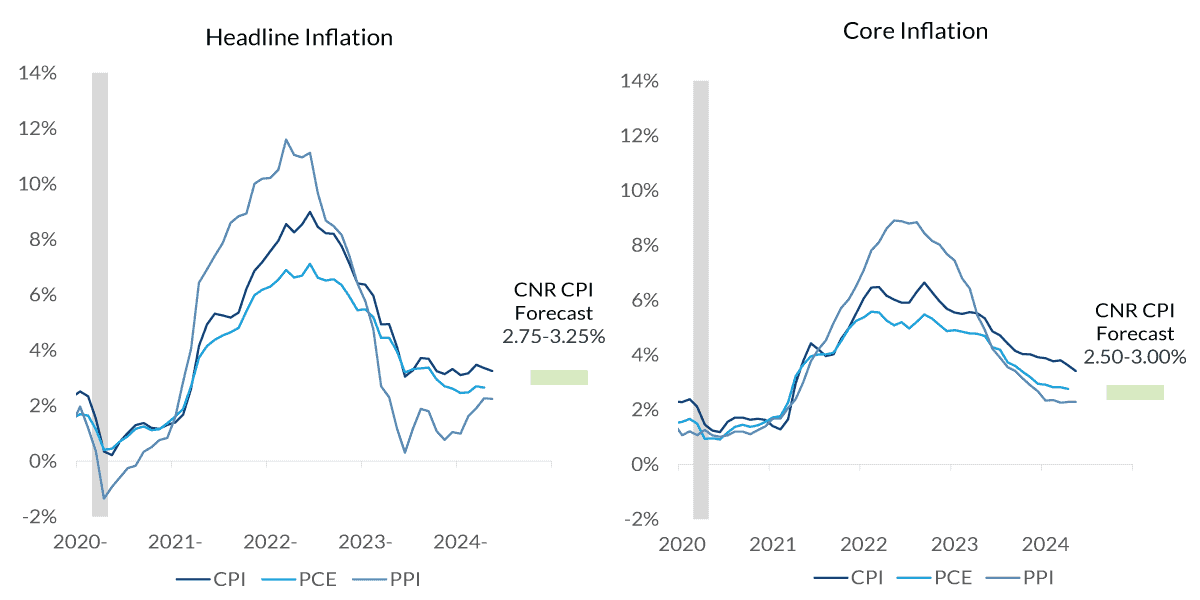
Source: St. Louis Fed as of June 2024.
Information is subject to change and is not a guarantee of future results..
To help reduce inflationary pressures, a goal of the Fed’s rate hikes has been to slow consumer demand. This appears to be working, with consumer spending slowing since the fourth quarter of 2023 and anticipated to slow further during the second half of 2024 as evidence builds that households may finally be becoming more cautious against the pressures of elevated prices and higher borrowing costs.
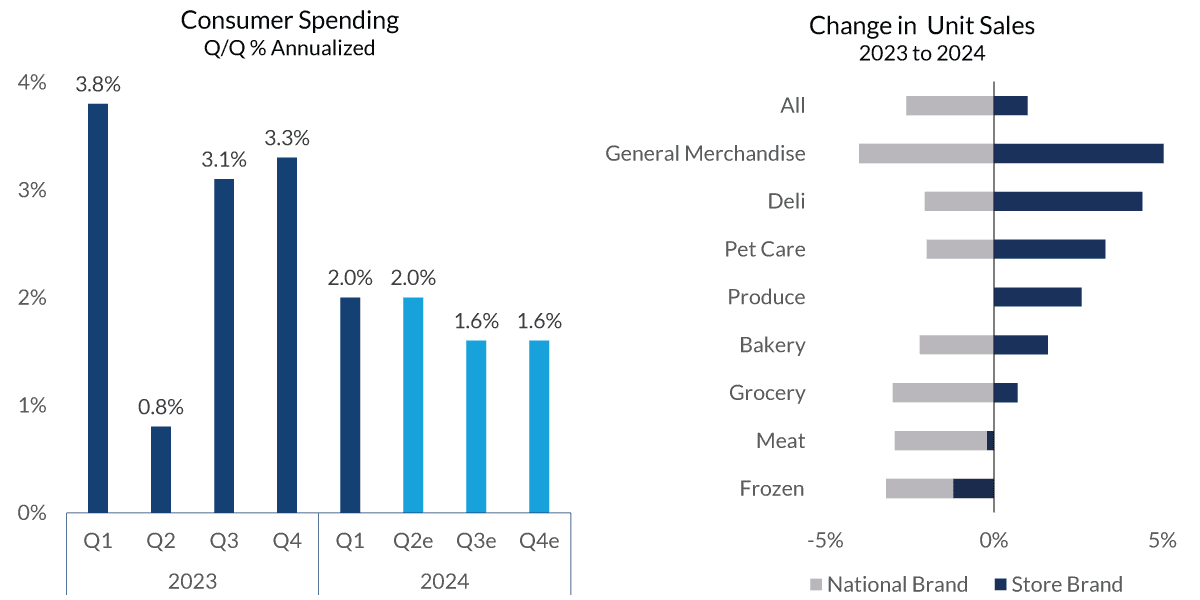
Source: Bloomberg, Wall Street Journal, NielsenIQ, as of June 2024.
Information is subject to change and is not a guarantee of future results
The bond market experienced extensive volatility during the first half of 2024, but most fixed income asset classes have erased losses and recorded positive returns in recent months. The best performers have been high-yield corporate bonds, with yields of 7.91% as of June 14, 2024, according to Bloomberg, followed by high-yield municipal bonds, with yields of 4.68%.
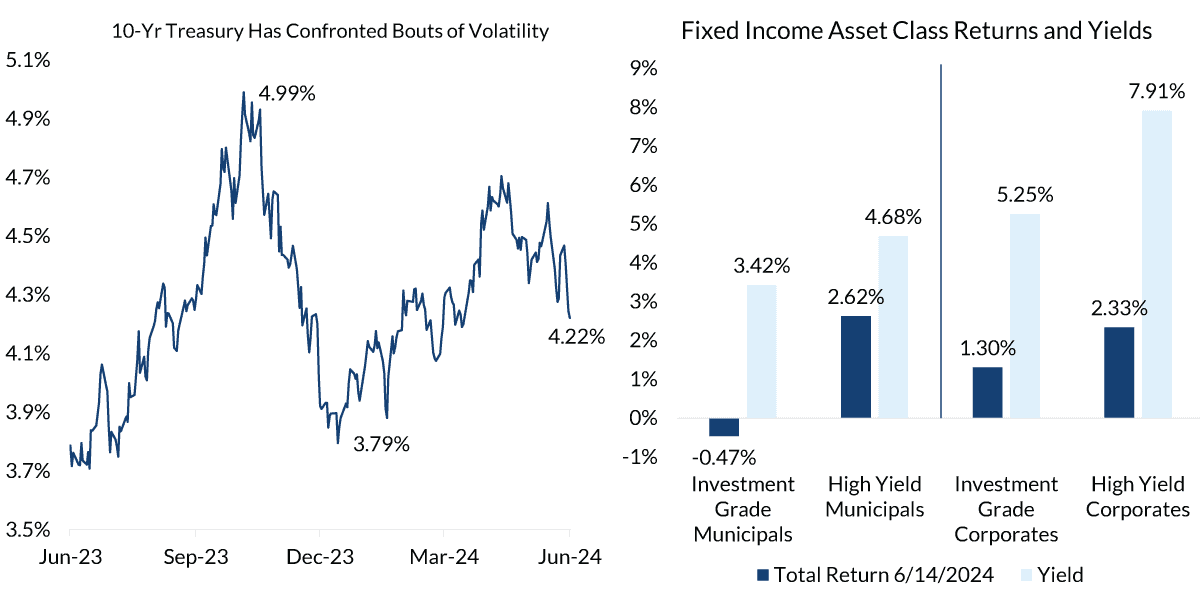
Source: Bloomberg as of 6/14/2024.
High Yield Municipal Bonds: Bloomberg 60% High Yield/40% Investment Grade Municipal Index, Municipal Bonds: Bloomberg Municipal Bond Index 1-15, High Yield Corporate Bonds: Bloomberg US High Yield Corporate Bonds, Corporate Bonds: Bloomberg US Intermediate Corporate Bond Index. Taxable equivalent yield assumes 37% Federal, 3.8% Medicare surcharge
Information is subject to change and is not a guarantee of future results.
Looking forward, attractive current yields may enhance cash flow generation while serving as a portfolio ballast during market volatility. Income generation should attract investor demand given its contribution to long-term return potential. Meanwhile, credit conditions remain sound, in our view, and should keep risk compensation in check amid a slowing economy.
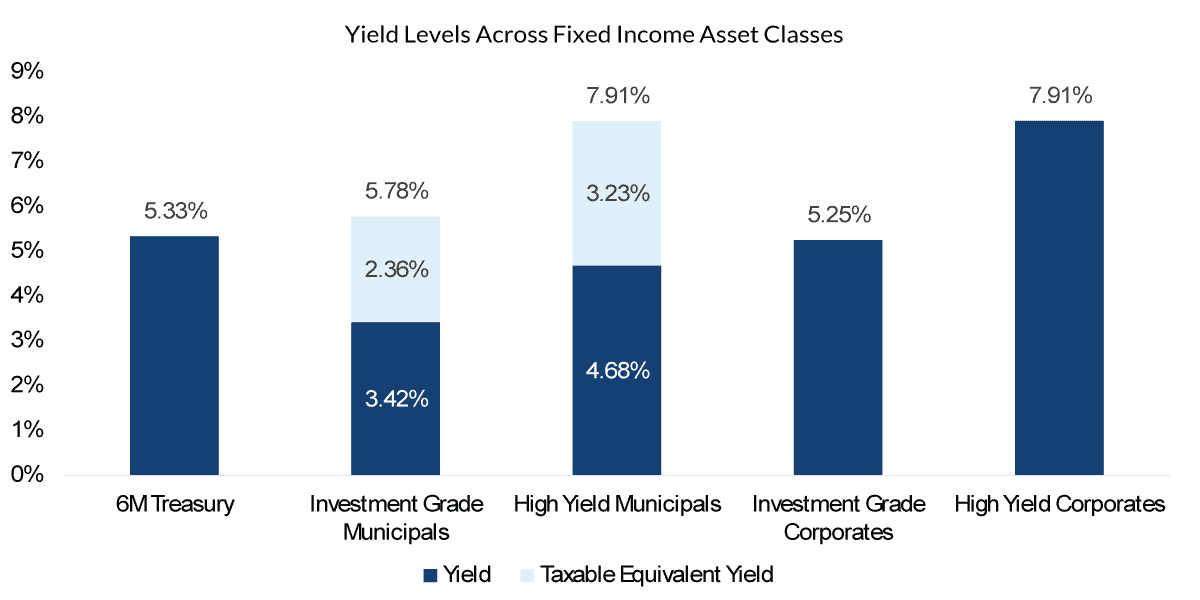
Source: Bloomberg as of 6/14/2024; Taxable equivalent yield assumes 37% Federal, 3.8% Medicare surcharge.
6M US Treasury, High Yield Municipal Bonds: Bloomberg 60% High Yield/40% Investment Grade Municipal Index, Municipal Bonds: Bloomberg Municipal Bond Index 1-15, High Yield Corporate Bonds: Bloomberg US High Yield Corporate Bonds, Corporate Bonds: Bloomberg US Intermediate Corporate Bond Index.
Information is subject to change and is not a guarantee of future results.
When looking at opportunistic income options, most markets are carrying significant current yields, presenting broad opportunities in our view. Overall, underlying market fundamentals continue to appear strong and supportive of positive returns. The addition of asset classes in portfolios such as Private Credit and CLOs could diversify and contribute to higher potential returns in the future.
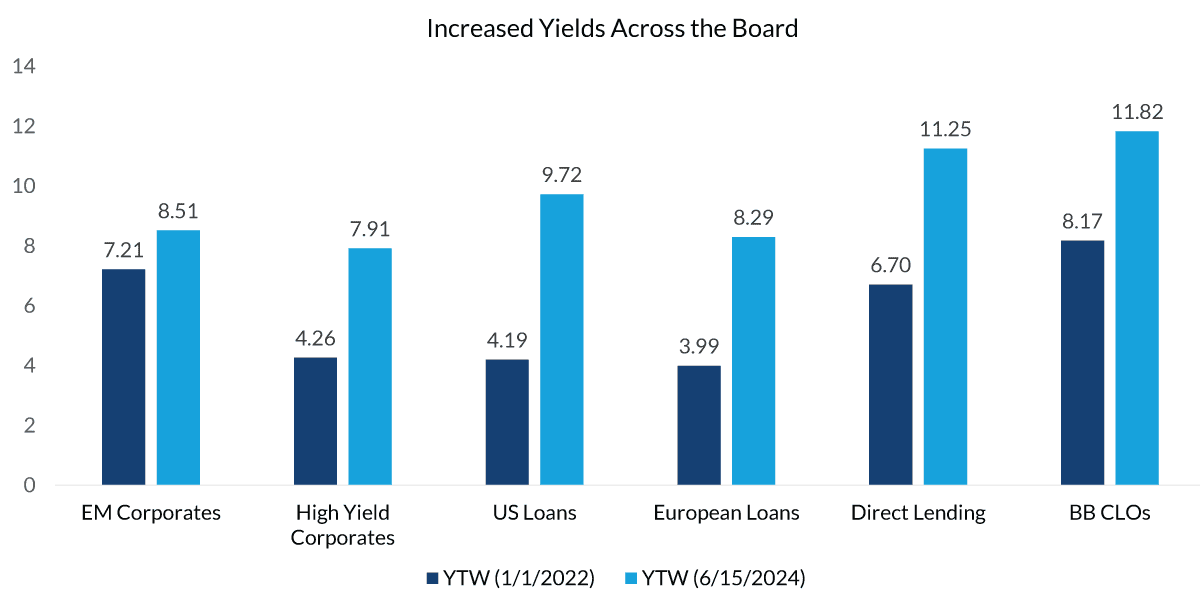
Source: Bloomberg, as of June 15, 2024.
Index representation: BB CLOs = Palmer Square CLO BB Total Return Index, Direct Lending = Cliffwater Corporate Lending, European Loans = Morningstar European Leveraged Loan Total Return Index, US Loans = Morningstar LSTA US Leveraged Loan Total Return Index, High Yield Corporates = Bloomberg US Corporate High Yield Total Return Index, EM Corporates = ICE BofA High Yield EM Corporates Total Return Index.
Past performance is no guarantee of future results.
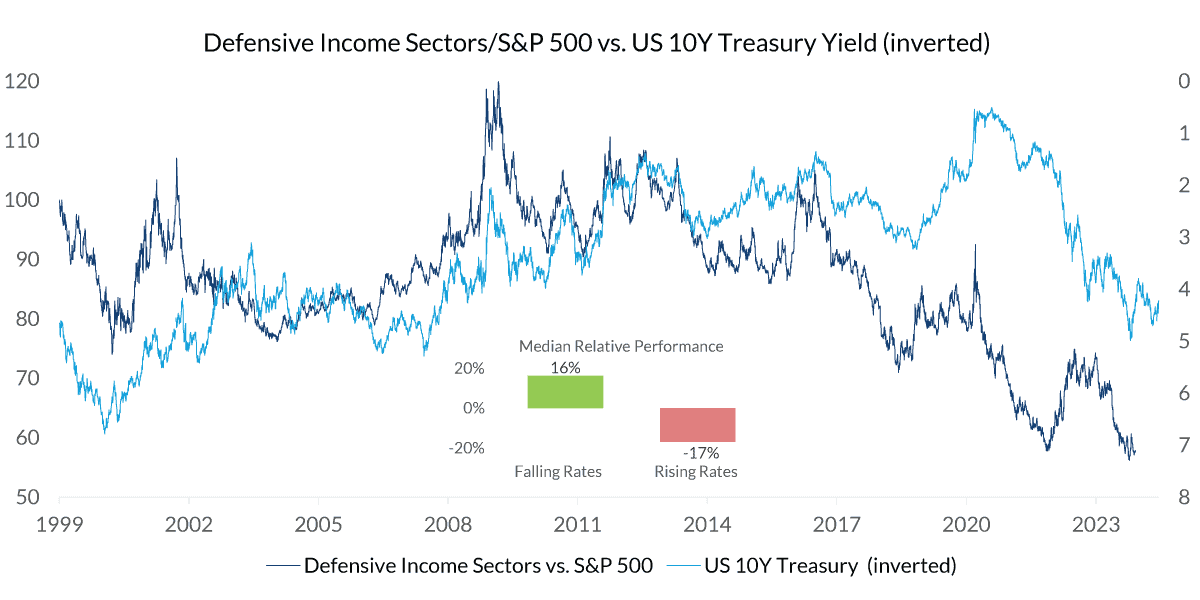
Investing defensively as part of our equity income strategy means that about 40% of our portfolios include utilities, staples and telecom stocks, which typically make up less than 10% of the broader market. These investments have been under pressure because they are historically impacted by interest rates, with yields rising when rates fall and declining when rates rise. Reactions are particularly pronounced when rates move quickly.
Source: FactSet, as of June 15, 2024.
Defensive sectors reflect a composite of the S&P 500 Consumer Staples (Sector) Net Total Return Index, S&P Telecommunications Services Industry Group Total Return Index, and the S&P 500 Utilities Total Return Index. Past performance is not a guarantee of future results. This is not representative of the performance of any CNR product or service.
If interest rates are finished rising and hold steady, that removes a significant headwind for these investments. If rates decline, that could signal improved performance ahead. However, if rates decline due to macroeconomic pressures, that could be a headwind to these investments.
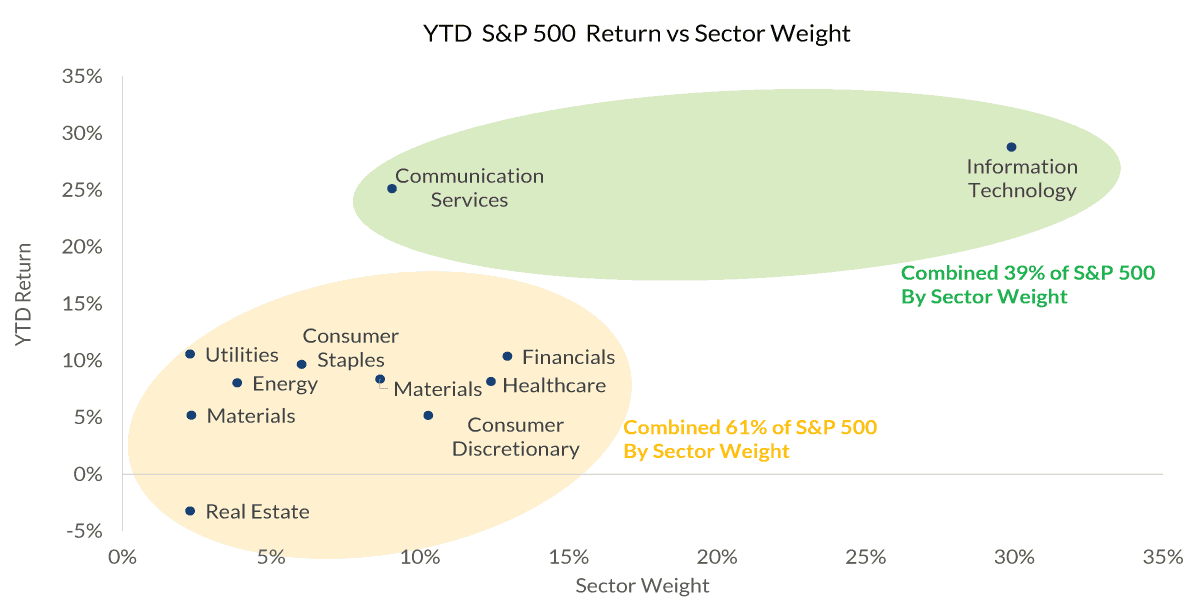
The stock market rally in 2024 has continued to be driven by growth stocks, especially tech-related. However, outperformance has narrowed compared to a similar point in time last year. More sectors are participating in the rally, including value and traditionally economic and interest rate segments, delivering solid to strong returns overall year to date.
Source: FactSet, as of June 2024.
Past performance is no guarantee of future results
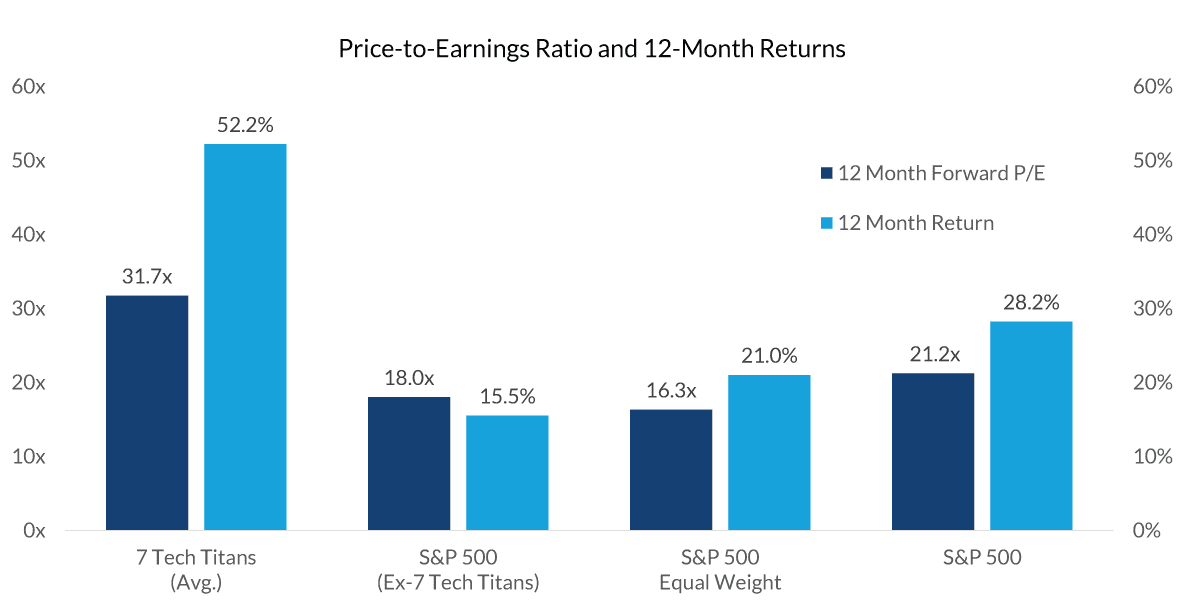
Valuation has been a tricky component of this market. The S&P is trading at a 22x multiple overall, but it’s an 18x multiple if we exclude the “magnificent seven” tech stocks and 16x if we give those tech stocks equal weight. By finding pockets of value in the market where we have high conviction, and while balancing that exposure against the tech stocks, we have confidence in our positioning.
Source: FactSet, as of June 2024.
Information is subject to change and is not a guarantee of future results.
Magnificent 7 Stocks/7 Tech Titans include Nvidia, Meta Platforms, Tesla, Amazon, Alphabet, Microsoft and Apple.
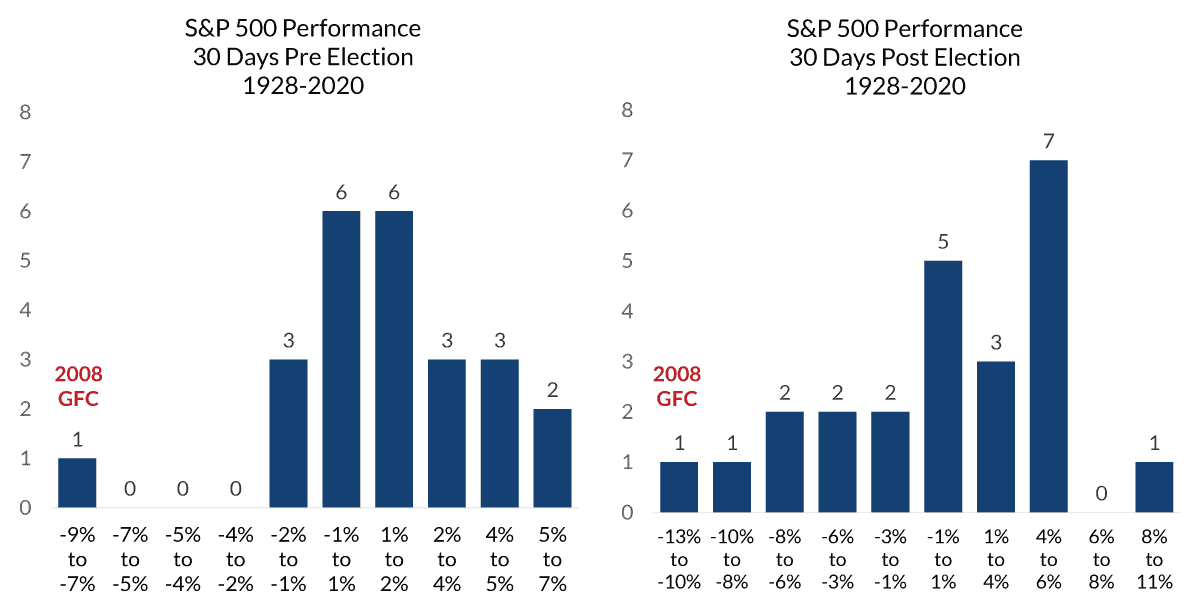
Historically, equities have performed well regardless of which political party is in control of the government, but uncertainty about potential policy shifts can lead to short-term volatility around elections. Typically, that volatility is more likely after the election outcome is known. It all depends on whether investors are concerned about policy uncertainty or whether there’s a “relief factor” that the election is over.
Source: FactSet, as of June 2024.
Past performance is no guarantee of future results.
GFC – Great Financial Crisis
Review Your Portfolio with Your Financial Advisor Today
City National Rochdale encourages you to review your investment portfolio with your advisor. Contact our financial professionals today to get help with your wealth planning needs.
Index Definitions
The Standard & Poor’s 500 Index (S&P 500) is a market capitalization-weighted index of 500 common stocks chosen for market size, liquidity and industry group representation to represent U.S. equity performance.
The Bloomberg Barclays US Corporate High Yield Index is an unmanaged, U.S.-dollar-denominated, nonconvertible, non-investment-grade debt index. The index consists of domestic and corporate bonds rated Ba and below with a minimum outstanding amount of $150 million.
The Bloomberg Barclays US Intermediate Corporate Bond Index is a measure of the investment-grade, fixed-rate, taxable corporate bond market. It includes USD-denominated securities publicly issued by U.S. and non-U.S. industrial, utility and financial issuers that have between 1 and up to, but not including, 10 years to maturity. The maturity range of the bonds included in the index is between 1 and 9.9999 years.
The Dow Jones U.S. Select Dividend Index aims to represent the U.S.’s leading stocks by dividend yield.
The IPC index is the main performance measure of companies listed on the Mexican Stock Exchange. It is calculated by balancing a weighted representative selection of shares from all economic sectors.
Citigroup Economic Surprise Index represents the sum of the difference between official economic results and forecasts.
The Zillow Observed Rent Index (ZORI) measures changes in asking rents over time, controlling for changes in the quality of the available rental stock.
Bloomberg 60% Tax-Exempt High Yield/40% Municipal Investment Grade TR Index Unhedged 1% issuer cap: A custom index comprised 60% of the Bloomberg Municipal Bond High Yield Index TR Unhedged and 40% of the Bloomberg Municipal Bond Index TR Unhedged. The issuer cap is 1%.
The Bloomberg Municipal 1-15 Year Index measures the performance of USD-denominated long-term, tax-exempt bond market with maturities of 1-15 years.
The Bloomberg US Corporate Aaa Index is designed to measure the Aaa-rated, fixed-rate, taxable corporate bond market. The index is based on the US Corporate Index, and includes USD-denominated securities publicly issued by U.S. and non-U.S. industrial, utility and financial issuers.
The Bloomberg A Corporate Index is designed to measure the A-rated, fixed-rate, taxable corporate bond market. The index is based on the US Corporate Index, and includes USD-denominated securities publicly issued by U.S. and non-U.S. industrial, utility and financial issuers.
The Bloomberg Baa Corporate Index is designed to measure the Baa-rated, fixed-rate, taxable corporate bond market. The index is based on the US Corporate Index, and includes USD-denominated securities publicly issued by U.S. and non-U.S. industrial, utility and financial issuers.
The Bloomberg US Credit 1-3 Index measures the performance of investment-grade, U.S. dollar-denominated, fixed-rate, taxable corporate and government-related debt with 1 to 2.9999 years to maturity.
ICE BofA High Yield EM Corporates Total Return Index. The index is designed to track the performance of U.S.-dollar-denominated, below-investment-grade corporate debt publicly issued in the U.S. domestic market.
Palmer Square CLO BB Total Return Index. A rules-based observable pricing and total return index for collateralized loan obligation (“CLO”) debt for sale in the United States, original rated A, BBB, BB or equivalent.
Morningstar European Leveraged Loan Total Return Index. A market-value-weighted multi-currency index designed to measure the performance of the European leveraged loan market.
Morningstar LSTA US Leveraged Loan Total Return Index. The index is designed to deliver comprehensive, precise coverage of the U.S. leveraged loan market. Underpinned by PitchBook | LCD data, the index brings transparency to the performance, activity and key characteristics of the market.
Bloomberg US Corporate Bond Total Return Index. The index is designed to measure the investment-grade, fixed-rate, taxable corporate bond market. It includes USD-denominated securities publicly issued by U.S. and non-U.S. industrial, utility and financial issuers.
Cliffwater Corporate Lending. Cliffwater LLC is an independent investment adviser and asset manager that provides research, advisory and investment services. Since 2004 the firm has provided advisory services and the most widely used accepted benchmark in the corporate direct lending space. Cliffwater Corporate Lending represents the performance of middle market corporate loans.
S&P 500 Consumer Staples (Sector) Net Total Return Index. The index is a market-cap-weighted index of U.S. Consumer Staples sector companies as defined by the Global Industry Classification in the S&P 500 Index.
S&P Telecommunications Services Industry Group Total Return Index The index is a market-cap-weighted index of U.S. Telecommunications Services industry group companies as defined by the Global Industry Classification in the S&P 500 Index.
S&P 500 Utilities Total Return Index. The index is a market-cap-weighted index of U.S. Utilities sector companies as defined by the Global Industry Classification in the S&P 500 Index.
The Bloomberg US Corporate Bond Index measures the investment-grade, fixed-rate, taxable corporate bond market. It includes USD-denominated securities publicly issued by U.S. and non-U.S. industrial, utility and financial issuers.
Definitions
6M T-Bills: The 6 Month Treasury Bill Rate is the yield received for investing in a U.S. government issued treasury bill that has a maturity of 6 months.
A collateralized loan obligation (CLO) is a single security backed by a pool of debt.
A consumer price index (CPI) measures changes in the price level of a market basket of consumer goods and services purchased by households. The CPI is a statistical estimate constructed using the prices of a sample of representative items whose prices are collected periodically.
A leveraged loan is a type of loan that is extended to companies or individuals that already have considerable amounts of debt or poor credit history.
A high-yield bond, or junk bond, is a corporate bond that represents debt issued by a firm with the promise to pay interest and return the principal at maturity. Junk bonds are issued by companies with poorer credit quality.
Muni Bond: A municipal bond is a debt security issued by a state, municipality or county to finance its capital expenditures, including the construction of highways, bridges or schools. These bonds can be thought of as loans that investors make to local governments.
Liquidity Management: The liquidity index calculates the days required to convert a company’s trade receivables and inventory into cash.
Investment Grade Municipal Bonds: Investment-grade municipal bonds are debt securities issued by state and local governments carrying the lowest credit risk that a bond issuer may default. Investment Grade Municipal Bonds: Bloomberg Municipal Bond Inter-Short 1-10 Year Total Return Index.
Investment Grade Corporate Bonds: Investment-grade corporate bonds are low-risk bonds. Because they are bonds, they are not tied to equity. Instead, they are like debt notes issued by a corporation. Investment Grade Corporate Bonds: Bloomberg Intermediate Corporate Bond Index.
The “core” Personal Consumption Expenditures (PCE) price index is defined as prices excluding food and energy prices. The core PCE price index measures the prices paid by consumers for goods and services without the volatility caused by movements in food and energy prices to reveal underlying inflation.
The Producer Price Index (PPI) is a family of indexes that measures the average change over time in selling prices received by domestic producers of goods and services.
Municipal bonds (or “munis”) are a fixture among income-investing portfolios. Investors who want higher returns can invest in high-yield municipal bonds.
Gross Domestic Product (GDP) is the total monetary or market value of all the finished goods and services produced within a country’s borders in a specific time period.
Yield to Worst (YTW) is the lower of the yield to maturity or the yield to call. It is essentially the lowest potential rate of return for a bond, excluding delinquency or default.
Important Information
The views expressed represent the opinions of City National Rochdale, LLC (CNR), which are subject to change and are not intended as a forecast or guarantee of future results. Stated information is provided for informational purposes only, and should not be perceived as personalized investment, financial, legal or tax advice or a recommendation for any security. It is derived from proprietary and non-proprietary sources that have not been independently verified for accuracy or completeness. While CNR believes the information to be accurate and reliable, we do not claim or have responsibility for its completeness, accuracy or reliability. Statements of future expectations, estimates, projections and other forward-looking statements are based on available information and management's view as of the time of these statements. Accordingly, such statements are inherently speculative as they are based on assumptions that may involve known and unknown risks and uncertainties. Actual results, performance or events may differ materially from those expressed or implied in such statements.
All investing is subject to risk, including the possible loss of the money you invest. As with any investment strategy, there is no guarantee that investment objectives will be met, and investors may lose money. Diversification may not protect against market risk or loss. Past performance is no guarantee of future performance.
Indices are unmanaged, and one cannot invest directly in an index. Index returns do not reflect a deduction for fees or expenses.
CNR is free from any political affiliation and does not support any political party or group over another.
Bonds are subject to interest rate risks and will decline in value as interest rates rise.
HY: Investing in securities that are not investment grade offers a higher yield but also carries a greater degree of risk of default or downgrade and are more volatile than investment-grade securities, due to the speculative nature of their investments.
Equity investing strategies and products. There are inherent risks with equity investing. These risks include, but are not limited to, stock market, manager or investment style. Stock markets tend to move in cycles, with periods of rising prices and periods of falling prices.
Fixed income investing strategies and products. There are inherent risks with fixed income investing. These risks include, but are not limited to, interest rate, call, credit, market, inflation, government policy, liquidity or junk bond risks. When interest rates rise, bond prices fall. This risk is heightened with investments in longer-duration fixed income securities and during periods when prevailing interest rates are low or negative.
High-yield securities. Investments in below-investment-grade debt securities, which are usually called “high yield” or “junk bonds,” are typically in weaker financial health. Such securities can be harder to value and sell, and their prices can be more volatile than more highly rated securities. While these securities generally have higher rates of interest, they also involve greater risk of default than do securities of a higher-quality rating.
Municipal securities. The yields and market values of municipal securities may be more affected by changes in tax rates and policies than similar income-bearing taxable securities. Certain investors' incomes may be subject to the Federal Alternative Minimum Tax (AMT), and taxable gains are also possible. Investments in the municipal securities of a particular state or territory may be subject to the risk that changes in the economic conditions of that state or territory will negatively impact performance. These events may include severe financial difficulties and continued budget deficits, economic or political policy changes, tax base erosion, state constitutional limits on tax increases and changes in the credit ratings.
© 2024 City National Rochdale, LLC. All rights reserved.
City National Rochdale, LLC is an SEC-registered investment adviser and wholly-owned subsidiary of City National Bank. Registration as an investment adviser does not imply any level of skill or expertise. City National Bank is a subsidiary of the Royal Bank of Canada. City National Bank provides investment management services through its subadvisory relationship with City National Rochdale. Brokerage services are provided through City National Securities, Inc., a wholly-owned subsidiary of City National Bank and Member FINRA/SIPC.
CITY NATIONAL ROCHDALE LLC NON-DEPOSIT INVESTMENT PRODUCTS: • ARE NOT FDIC INSURED • ARE NOT BANK GUARANTEED • MAY LOSE VALUE