Insights
High Yield: Income Intact, Volatility in Focus
April 29, 2025

Key Points:
- Absolute yields remain compelling despite more significant price fluctuations.
- Broad positive credit fundamentals continue underpinning issuer quality.
- Diversification remains paramount to help insulate portfolios against spread risk.
Fixed income markets endured increased volatility throughout the first quarter (Q1), but despite a weakening in performance in March, high yield segments delivered overall positive total returns (see charts below). While economic uncertainties, particularly related to trade policy and the imposition of tariffs, had an uneven impact across asset classes, yields remained attractive and helped lure investor capital into both high yield bonds and bank loans (mainly in January and February). High yield municipals experienced similar demand as consistent net inflows throughout Q1 coupled with a muted supply of new issues bolstered performance.
Chart 1: Opportunistic Income Yields Remain Attractive

Source: Bloomberg, as of March 2025. Past performance is no guarantee of future results.
The ability to capture attractive income has reinforced the case for risk products and remains underpinned by durable credit fundamentals. Across markets, issuer quality is mostly stable while default levels remain manageable and below their long-term averages. The upgrade-to-downgrade ratio, which indicates the margin of improvement vs. deterioration, continues to be positive. However, risk pricing vis-à-vis credit spreads became more volatile during Q1, but diversification may mitigate event risk and be additive to portfolio performance. For example, emerging market corporate high yield bonds1 was an outperformer versus other high yield asset classes (chart 2). Monitoring spreads will become increasingly important as market conditions change. During Q1, the Bloomberg U.S. Corporate High Yield Index option-adjusted spread (OAS) increased by about 60 bps despite hitting intra-quarter lows of about 255 bps in January and February. Conversely, high yield municipal bond2 spreads remain more stable because of their slower reaction to market and economic trends. Nevertheless, we continue to monitor the market and may view periods of dislocation as opportunities to adjust positioning.
Chart 2: Asset Class Performance
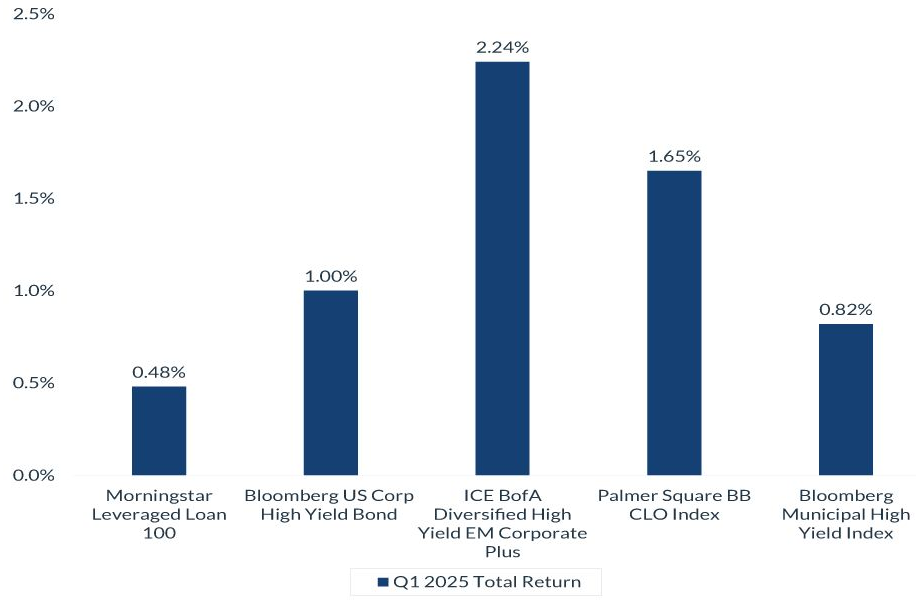
Source: Bloomberg, as of March 2025. Past performance is no guarantee of future results.
In the near-term, we expected bouts of volatility to persist, and any temporary disruptions can lead to attractive entry points to put cash to work and reshape portfolio allocations. With relatively strong balance sheets, lower default rates and a still accommodative central bank, maintaining exposure to a diverse set of asset classes should benefit portfolios. Macro uncertainty could impact total return potential, but we continue to see value in higher absolute yields available within opportunistic income and private credit. Further, we expect new issue sales to remain soft in high yield municipal bonds, and while sector quality is mostly neutral, some areas of stress, like project finance, require more thorough due diligence.
1 EM Corp: The emerging markets bond index (EMBI) is a benchmark index for measuring the total return performance of international government and corporate bonds issued by emerging market countries that meet specific liquidity and structural requirements.
2 Bloomberg Municipal High Yield Bond Index: The Bloomberg Municipal High Yield Bond Index measures the performance of non-investment grade, US dollar-denominated, and non-rated, tax-exempt bonds.
Important Information
The views expressed represent the opinions of City National Rochdale, LLC (CNR) which are subject to change and are not intended as a forecast or guarantee of future results. Stated information is provided for informational purposes only, and should not be perceived as personalized investment, financial, legal or tax advice or a recommendation for any security. It is derived from proprietary and non-proprietary sources which have not been independently verified for accuracy or completeness. While CNR believes the information to be accurate and reliable, we do not claim or have responsibility for its completeness, accuracy, or reliability. Statements of future expectations,estimates, projections, and other forward-looking statements are based on available information and management’s view as of the time of these statements. Accordingly, such statements are inherently speculative as they are based on assumptions which may involve known and unknown risks and uncertainties. Actual results, performance or events may differ materially from those expressed or implied in such statements.
All investing is subject to risk, including the possible loss of the money you invest. As with any investment strategy, there is no guarantee that investment objectives will be met, and investors may lose money. Diversification may not protect against market risk or loss. Past performance is no guarantee of future performance.
© 2025 City National Bank. All rights reserved.
Index Definitions
S&P 500 Index: The S&P 500 Index, or Standard & Poor’s 500 Index, is a market-capitalization-weighted index of 500 leading publicly traded companies in the US It is not an exact list of the top 500 US companies by market cap because there are other criteria that the index includes.
Bloomberg Municipal Bond Index: The Bloomberg US Municipal Bond Index measures the performance of investment grade, US dollar-denominated, long-term tax-exempt bonds.
Bloomberg Municipal High Yield Bond Index: The Bloomberg Municipal High Yield Bond Index measures the performance of non-investment grade, US dollar-denominated, and non-rated, tax-exempt bonds.
Bloomberg Investment Grade Index: The Bloomberg US Investment Grade Corporate Bond Index measures the performance of investment grade, corporate, fixed-rate bonds with maturities of one year or more.
The Bloomberg Magnificent 7 Total Return Index: Bloomberg Magnificent 7 Total Return Index is an equal-dollar weighted equity benchmark consisting of a fixed basket of 7 widely-traded companies classified in the United States and representing the Communications, Consumer Discretionary and Technology sectors as defined by Bloomberg Industry Classification System (BICS).
Nasdaq is a global electronic marketplace for buying and selling securities. Its name was originally an acronym for the National Association of Securities Dealers Automated Quotations.
The Dow Jones Industrial Average (DJIA) tracks thirty of America’s biggest and most established companies, acting like a quick temperature check of the U.S. economy.
The MSCI USA Large Cap Index is designed to measure the performance of the large cap segments of the US market. The index covers approximately 70% of the free float-adjusted market capitalization in the US.
The Bloomberg Investment Grade Corporate Bond Spreads refer to the spreads between investment grade, fixed-rate, taxable corporate bonds.
BVAL Municipal AAA Benchmark is a municipal bond benchmark. It provides a 5% coupon benchmark yield curve for high-quality US municipal bonds with an average rating of “AAA” from Moody’s and S&P.
The 10-year BVAL AAA municipal treasury index compares the yield on a AAA rated municipal bond to that of a Treasury before factoring in the effect of taxes.
The Morningstar LSTA US Leveraged Loan 100 Index is designed to measure the performance of the 100 largest facilities in the US leveraged loan market.
The ICE BofA Diversified High Yield US Emerging Markets Corporate Plus Index tracks the performance of US dollar denominated below investment grade emerging markets non-sovereign debt publicly issued in the major domestic and eurobond markets.
The Palmer Square CLO Senior Debt Index is a rules-based observable pricing and total return index for CLO debt for sale in the United States, rated at the time of issuance as AAA or AA (or an equivalent rating).
The Russell 3000 is a broad equity index composed of the 3,000 largest U.S. listed stocks, representing more than 95% of the investable American stock market.
The MSCI ACWI ex USA Index captures large and mid cap representation across Developed Markets (DM) countries (excluding the US) and Emerging Markets (EM) countries. The index covers approximately 85% of the global equity opportunity set outside the US.
Definitions
The “core” Personal Consumption Expenditures (PCE) price index is defined as prices excluding food and energy prices. The core PCE price index measures the prices paid by consumers for goods and services without the volatility caused by movements in food and energy prices to reveal underlying inflation.
A leveraged loan is a type of loan that is extended to companies or individuals that already have considerable amounts of debt or poor credit history.
Yield to worse (YTW) is the lowest potential yield that an issuer can pay on a bond without defaulting.
The Magnificent 7 refers to a group of major tech companies with stock growth that far outpaced the high-performing S&P 500 in recent years. Coined in 2023, the group consists of Alphabet, Amazon, Apple, Meta Platforms, Microsoft, Nvidia, and Tesla.
© 2025 City National Bank. All rights reserved.
Non-deposit investment Products are: • not FDIC insured • not Bank guaranteed • may lose value
Stay Informed.
Get our Insights delivered straight to your inbox.
More from the Quarterly Update
Put our insights to work for you.
If you have a client with more than $1 million in investable assets and want to find out about the benefits of our intelligently personalized portfolio management, speak with an investment consultant near you today.
If you’re a high-net-worth client who's interested in adding an experienced investment manager to your financial team, learn more about working with us here.