
Videos › Economic Perspectives › February 2026
-
Economic Perspectives
GDP Slows Due to Government Shutdown, Outlook Remains Robust
February 2026
- Filename
- Economic Perspectives February 2026.pdf
- Format
- application/pdf

TRANSCRIPT
This month, we are looking at the recent GDP release, the broadest measure of economic growth. It came in at 1.4%, surprisingly below expectations of 2.5% to 3.0%. Fortunately, it does not indicate a weakening of the economy, but rather the result of the lengthy federal government shutdown.
Let’s take a look at some charts.
GDP
% change, seasonally adjusted annualized rate
Data current as of February 25, 2026.
Source: Bureau of Economic Analysis
Information is subject to change and is not a guarantee of future results.
Chart 1, 0:36– Here we are looking at the quarterly change in GDP, which shows the recent quarter’s growth at 1.4%, well below the previous quarter’s growth of 4.4%.
The bright blue line represents the yearly change in GDP, which is up 2.4% ‒a solid pace.
To put the annual growth rate in context, the Fed has what it calls the “longer-term” rate, which represents a sustainable pace of growth that is consistent with a low unemployment rate and a low level of inflation. It is sort of the ideal rate, but at 1.8% you can see that the economic is currently growing faster than that rate.
GDP Performance: 2025: Q4
% change, seasonally adjusted annual rate
Data current as of February 25, 2026.
Source: Bureau of Economic Analysis
Information is subject to change and is not a guarantee of future results.
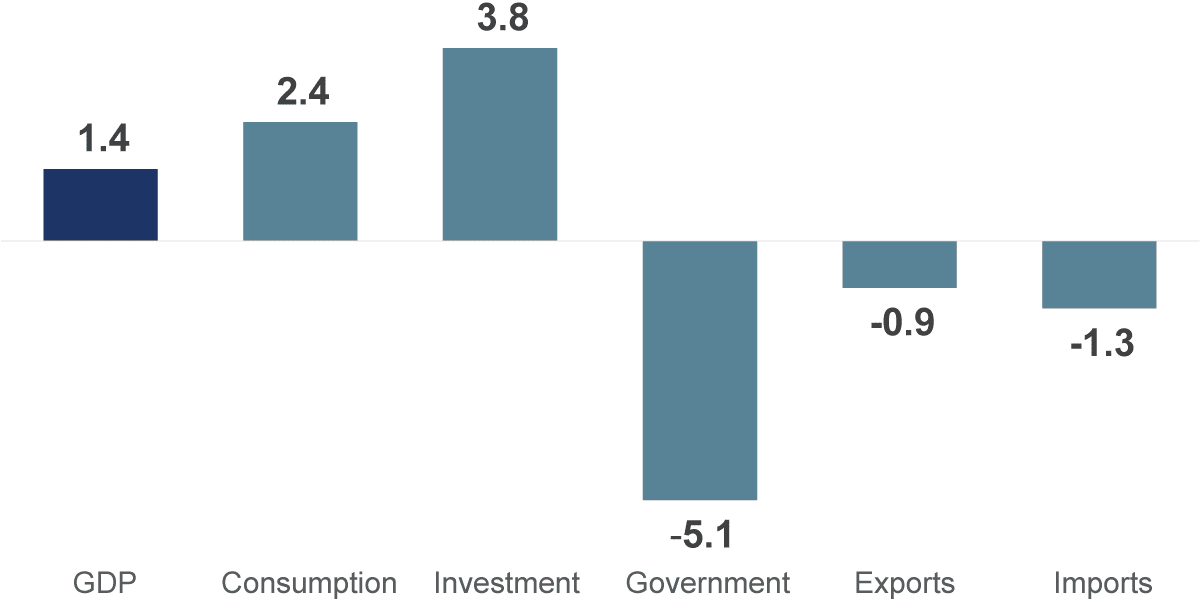
Chart 2, 1:15– This chart shows the quarterly, annualized growth rates of GDP and its major components. The most notable is the large decline in government, falling 5.1%.
GDP: Weighting: 2025: Q4
% of total
Data current as of February 25, 2026.
Source: Bureau of Economic Analysis
Information is subject to change and is not a guarantee of future results.
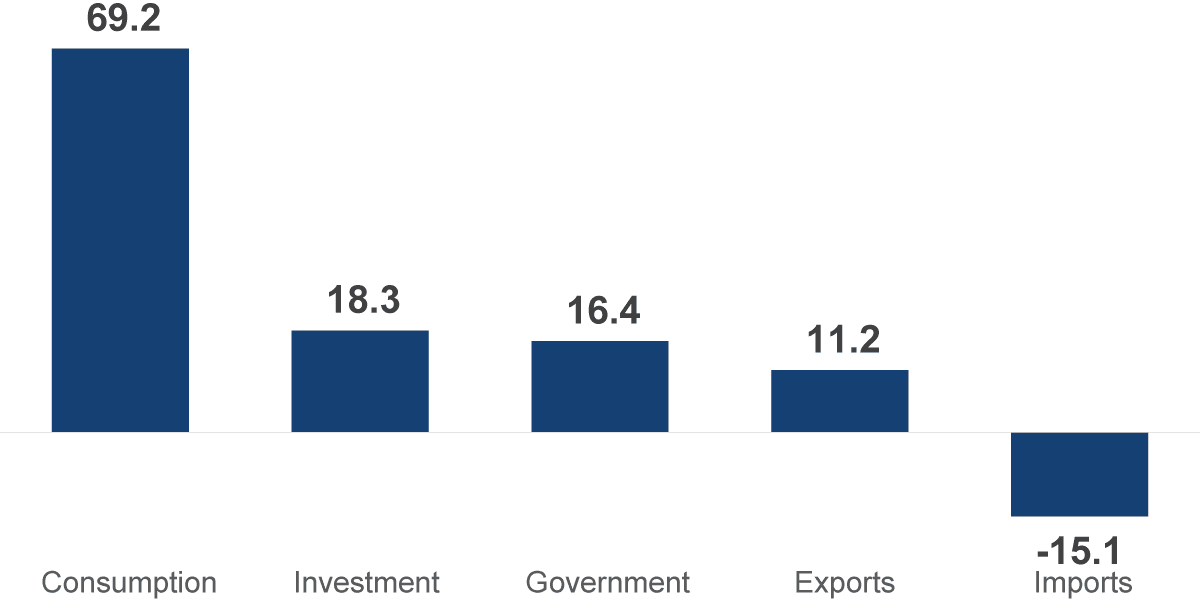
Chart 3, 1:27– Now, each component does not have equal weight. In this chart, you can see that consumption, or personal spending, has the lion’s share of the GDP calculation.
GDP 2024: Q4: Contribution
%, seasonally adjusted annual rate
Data current as of February 25, 2026.
Source: Bureau of Economic Analysis
Information is subject to change and is not a guarantee of future results.
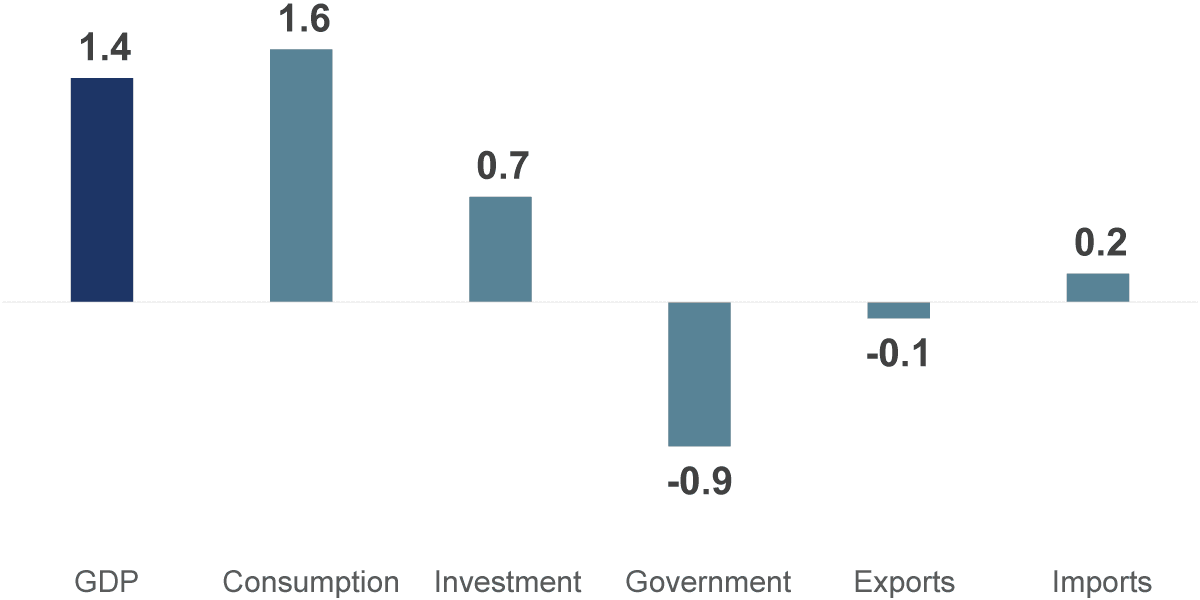
Chart 4, 1:45– To figure out the impact each component has on GDP, it is simply the performance multiplied by the weighting, as shown in the chart. Consumption added 1.6 percentage points, while all the other components took away 0.2 percentage points to give the 1.4% growth rate. The government component took almost a full percentage point away from GDP.
GDP: Contribution in 2025:Q4
% change, annual rate, seasonally adjusted
Data current as of February 25, 2026.
Source: Bureau of Economic Analysis
Information is subject to change and is not a guarantee of future results.
Chart 5, 2:05– For a breakdown of the driving influence on each component, we will start with consumption, which remains the driving force of the post-pandemic expansion. You can see that all the growth this past quarter came from services. Goods, which account for about one-third of consumer spending, didn’t contribute to fourth-quarter growth. This was mostly due to the volatile auto sales in recent quarters. On September 30, at the end of the third quarter, tax credits for electric vehicles expired, which accelerated purchases in Q3, leading to a pullback in Q4.
The investment component also contributed positively to GDP. Most of its growth came from the nonresidential subcomponent, driven by investments in artificial intelligence data centers. Spending on them has set records in recent quarters. A change in the level of inventories added a little bit, and residential, which is housing, declined a tad. That is not a surprise; it is the fourth straight decline and has fallen in six of the past seven quarters.
Due to the federal government shutdown for almost half of the quarter, the government component declined substantially. Non-defense spending fell by 24.1%; when weighed, it contributed a -0.7 percentage points to GDP. The federal government buys a lot of cars, trucks, computers, printers, etc. As for defense spending, that tends to be volatile on a quarterly basis, so the decline is not surprising. As for state and local governments, they account for about 2/3rds of the weighting for this component. Their contribution to GDP tends to be stable.
As for trade, after two quarters of large swings in imports due to the tariff hikes, it has returned to being a small contributor to GDP. Imports of goods and services were not as large in Q4 as in Q3, so they made a small positive contribution to GDP. Exports were not as large in Q4 as they were in Q3, so they made a slight negative contribution.
So, what does this all mean? The federal government shutdown was more disruptive than expected: without it, Q4 GDP would have been 2.25%, a healthy pace well above potential growth. More importantly, the outlook points to a strong rebound in 2026. In Q1, federal government spending will bounce back, probably not by the full amount but close to it. Inventories should return to a more normal rate of increase, and investment is expected to continue to grow amid the AI frenzy. As for consumer spending, it may be tempered somewhat due to the severe weather in January and February. But history has taught us that if consumption falls in a quarter due to bad weather, it bounces back the following quarter: money seems to burn a hole in consumers’ pockets.
Important Information
The views expressed represent the opinions of RBC Rochdale, LLC which are subject to change and are not intended as a forecast or guarantee of future results. Stated information is provided for informational purposes only, and should not be perceived as personalized investment, financial, legal or tax advice or a recommendation for any security. It is derived from proprietary and non-proprietary sources which have not been independently verified for accuracy or completeness. While RBC Rochdale believes the information to be accurate and reliable, we do not claim or have responsibility for its completeness, accuracy, or reliability. Statements of future expectations, estimates, projections, and other forward-looking statements are based on available information and management's view as of the time of these statements. Accordingly, such statements are inherently speculative as they are based-on assumptions which may involve known and unknown risks and uncertainties. Actual results, performance or events may differ materially from those expressed or implied in such statements.
All investment strategies have the potential for profit or loss; changes in investment strategies, contributions or withdrawals may materially alter the performance and results of a portfolio. Different types of investments involve varying degrees of risk, and there can be no assurance that any specific investment will be suitable or profitable for a client's investment portfolio.
RBC Rochdale, LLC is an SEC-registered investment adviser and wholly-owned subsidiary of City National Bank. Registration as an investment adviser does not imply any level of skill or expertise. City National Bank is a subsidiary of the Royal Bank of Canada.
© 2026 RBC Rochdale, LLC. All rights reserved.
