
Videos › Economic Perspectives › March 2026
-
Economic Perspectives
A Review of Oil Fundamentals
March 2026
- Filename
- Economic Perspectives March 2026.pdf
- Format
- application/pdf

TRANSCRIPT
Given oil's prominence in the news, this month’s presentation offers a background on the oil market.
To start with, the economy and its relationship with oil are very different now compared to the past. Yes, gasoline prices are soaring, but there doesn’t appear to be any risk of shortages, like in the 1970s, when states needed to impose restrictions on certain days that motorists could buy gasoline. Or when President Nixon gave a speech calling on Americans to take steps to limit energy use, such as reducing home heating temperatures and driving at slower speeds.
Since the 1970s, the U.S. has seen improvements in energy efficiency, increased petroleum production and the creation of large oil stockpiles. And they have increased the use of alternative energy sources, such as wind and solar. All of this has served as a buffer, reducing vulnerability. All of this has increased the country’s energy independence.
Let’s take a look at some charts.
Fuel Economy for Cars
miles per gallon
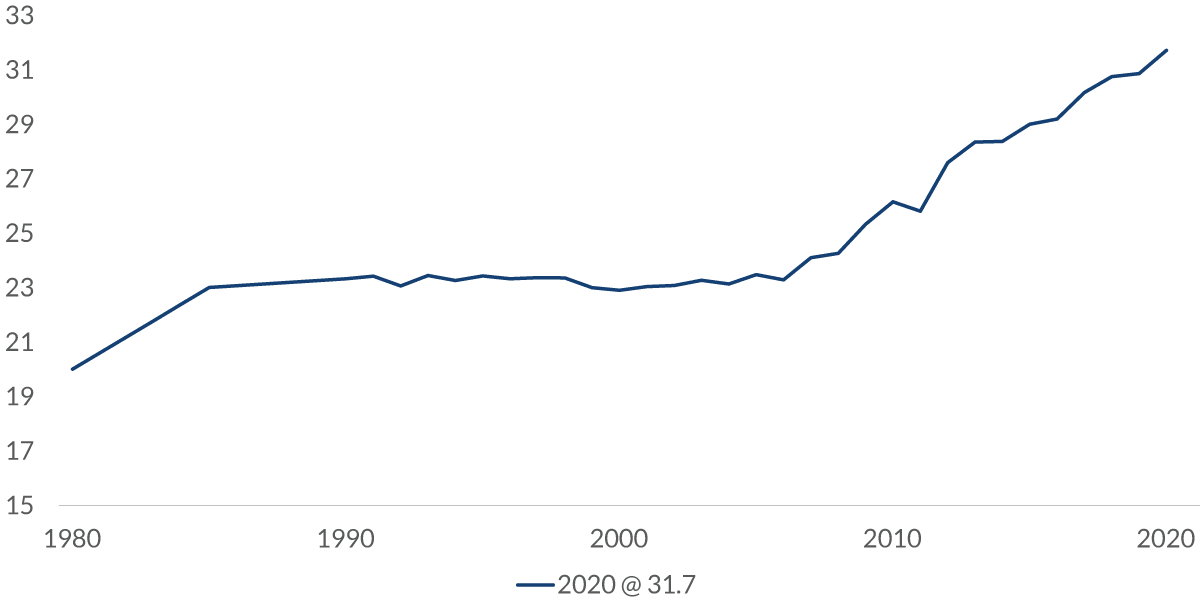
Data current as of March 23, 2026.
Source: U.S. Department of Energy
Information is subject to change and is not a guarantee of future results.
Chart 1, 1:18– For example, vehicles are now required to have better gas mileage. In 1980, we were getting around 19 miles to the gallon, Now we're averaging close to 32. That's an increase of almost 60%
Spending on Energy
% of total spending, seasonally adjusted
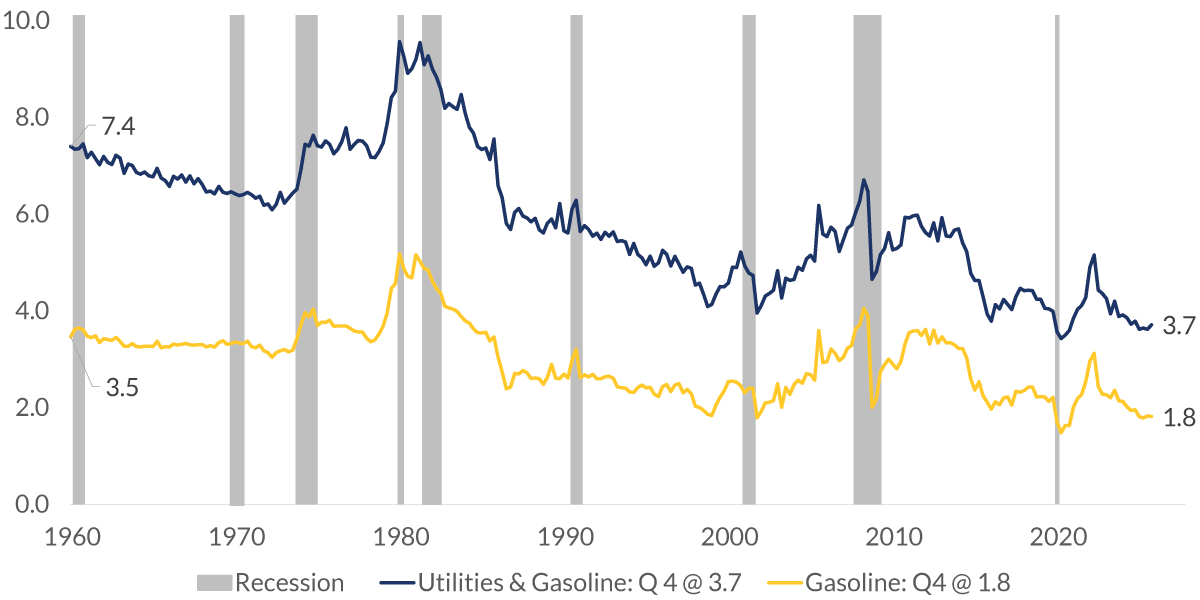
Data current as of: March 23, 2026
Source: Federal Reserve
Information is subject to change and is not a guarantee of future results.
Chart 2, 1:31– Homes and buildings are now required to have far better insulation. This has cut the share of money consumers must spend on gasoline and utilities in half from what they paid in 1960, giving them more disposable income.
Oil Intensity: GDP and Petroleum Consumption
%, indexed at 0.0 on 1950:Q1, seasonally adjusted
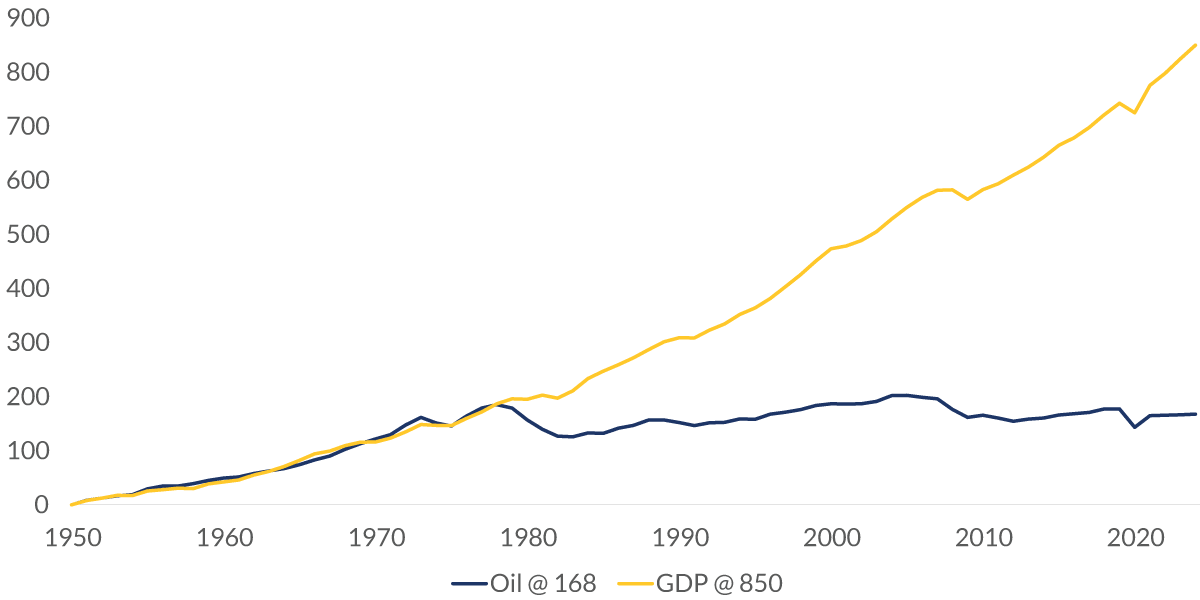
Data current as of: March 23, 2026
Source: Bureau of Economic Analysis, U.S. Department of Energy
Information is subject to change and is not a guarantee of future results.
Chart 3, 1:46– Take a look at this chart. The yellow line shows the percent change in GDP since 1950. The blue line shows the percent change in petroleum consumption. From 1950 to about 1980, petroleum consumption and economic growth moved in tandem. That period was when the U.S. economy was the “manufacturer of the world,” which required a lot of energy. Since then, the country has transitioned to a service-based economy, where energy demand is lower. As a result, oil consumption in the U.S. has flatlined while economic output has exploded.
Crude Oil Production: U.S.
millions of barrels per day, not seasonally adjusted
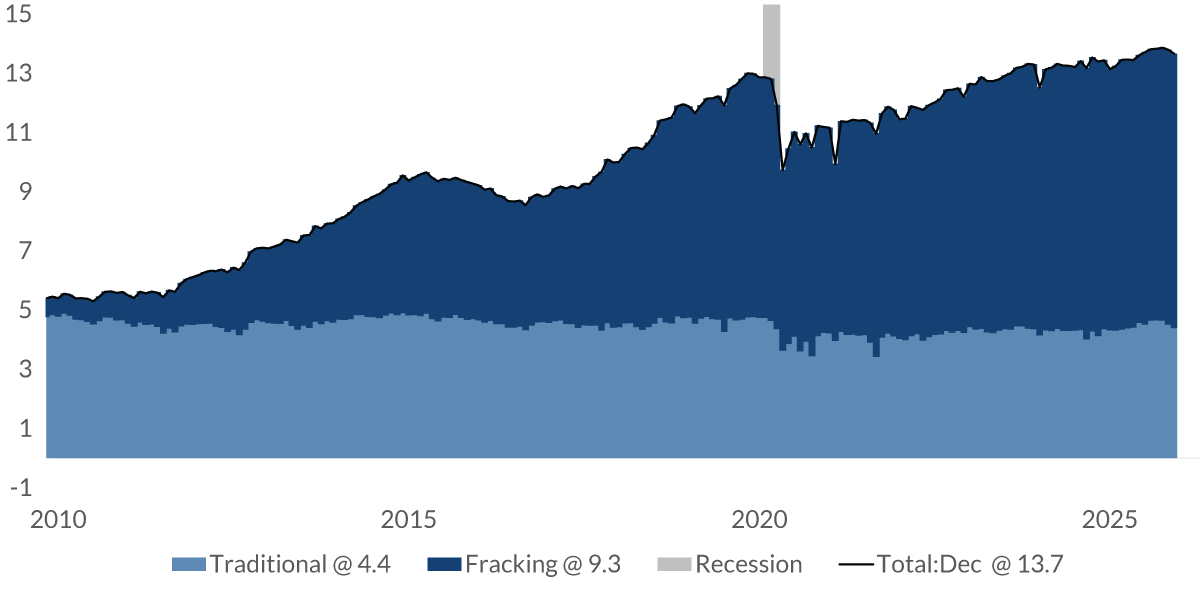
Data current as of: March 23, 2026
Source: Energy information Administration (Department of Energy)
Information is subject to change and is not a guarantee of future results.
Chart 4, 2:23– There are other very important changes regarding oil. Most notable is the increase in the amount of oil the U.S. produces. Advances in fracking technology have allowed the country to increase oil production. From 2010 to today, production has increased from about 5.5 million barrels a day to almost 14 million. As you can see, most of that growth came from fracking (indicated by the dark blue in this chart), which now makes up about two-thirds of our total production. Fracking produces a lightweight oil with low viscosity, unlike most drilled wells, which produce a heavier-weight oil. Most U.S. refineries are designed to process heavier oil. As a result, the U.S. exports much of its fracked oil and imports heavier crude, which domestic refineries are better equipped to handle.
Crude Oil: Imports & Exports
millions of barrels per day
Data current as of: March 23, 2026
Source: U.S. Department of Energy
Information is subject to change and is not a guarantee of future results.
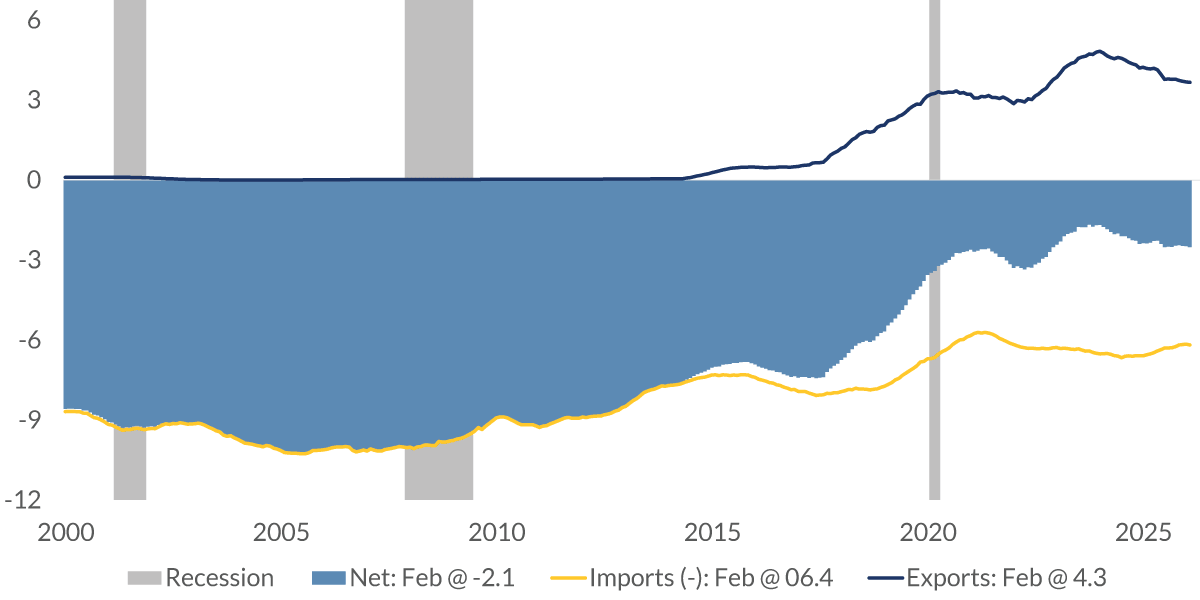
Chart 5, 3:19– When looking at crude oil alone, the U.S. is still a net importer. The dark blue line shows the amount of crude that is exported while the yellow line shows what is imported. The shaded area is the net difference. Look at the improvement: The United States is today a net importer of 2.1 million barrels a day, about one fifth of what it imported daily in the early 2000s.
Petroleum Products: Imports & Exports
millions of barrels per day , 12-mo rolling average
Data current as of: March 23, 2026
Source: Energy information Administration (Department of Energy)
Information is subject to change and is not a guarantee of future results.
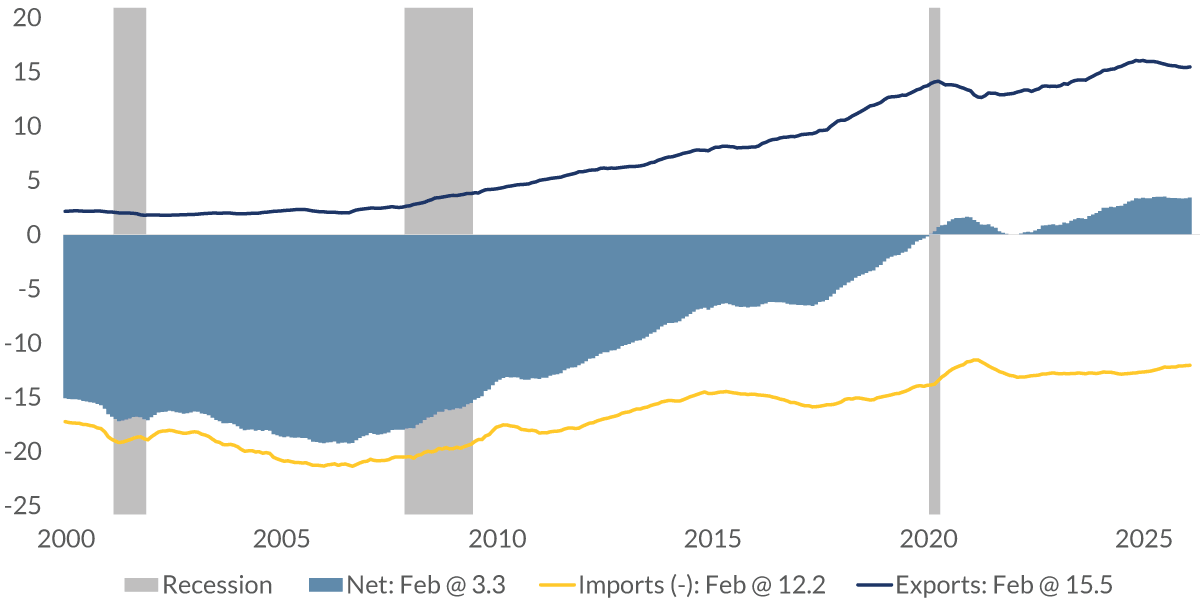
Chart 6, 3:45– But when looking at the broader range of petroleum products (oil, jet fuel, diesel, LNG, etc.), we see that the U.S. is a net exporter. That can be seen in this chart. That is a magnificent change. The country has moved from a deficit of 18 million barrels per day in 2007 to a surplus of 3.3 million. That is because a byproduct of fracking is the release of natural gas. The United States produces a lot of natural gas and now exports it.
Natural Gas Exports
billion cubic feet
Data current as of: March 23, 2026
Source: U.S. Department of Energy
Information is subject to change and is not a guarantee of future results.
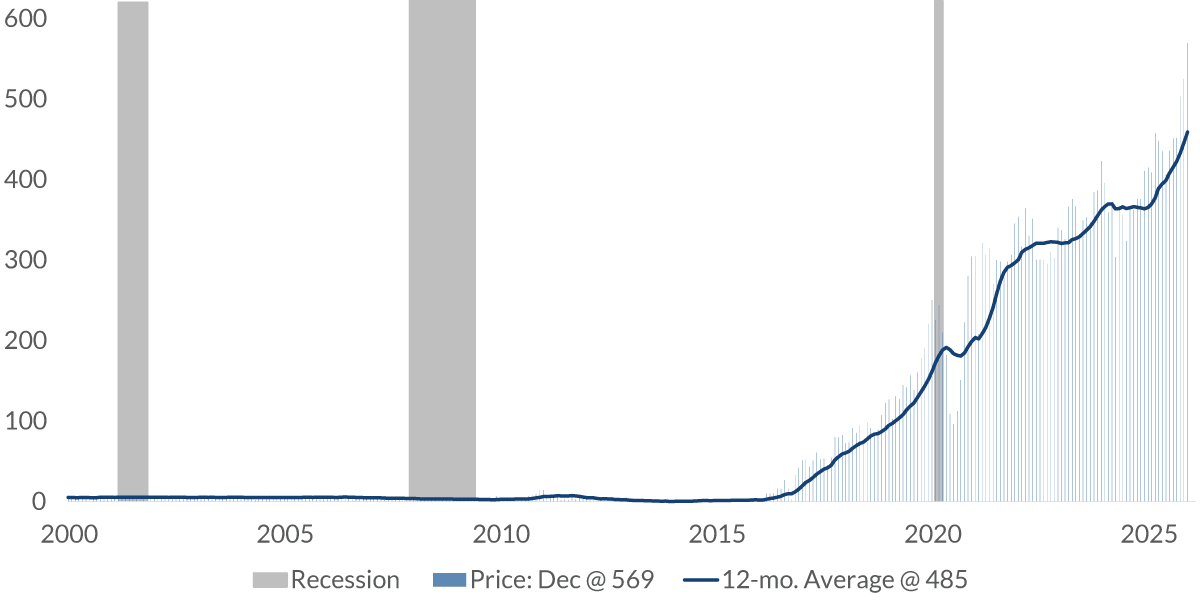
Chart 7, 4:19– Since the broad use of fracking has increased significantly around 2015, the United States has become a large exporter of liquified natural gas.
Crude Oil: Imports
millions of barrels per day
Data current as of: March 23, 2026
Source: U.S. Department of Energy
Information is subject to change and is not a guarantee of future results.
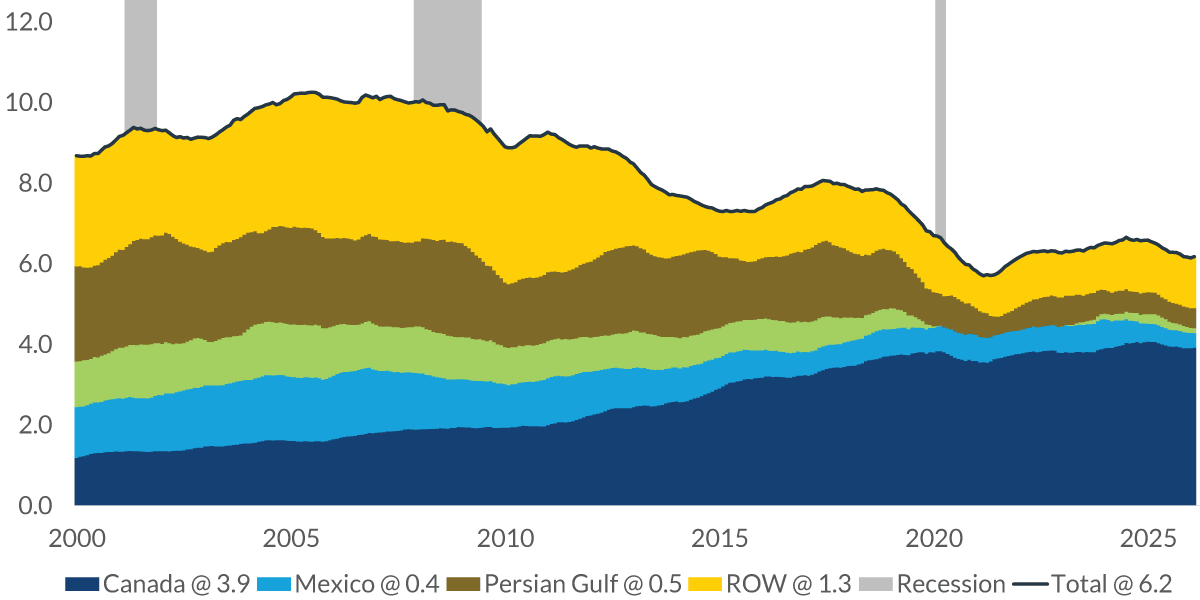
Chart 8, 4:32– Another important issue is the source of the crude oil we import. In the 1970s, about 40% of it came from the Persian Gulf; today, that oil accounts for just 8.0% of the oil the U.S. imports. The lion's share of imported oil comes from our neighbors, Canada (64%) and Mexico (6%) — both friendly sources of oil.
What does this all mean? Oil and other petroleum products are a global commodity. The price we pay is about the same as the rest of the world. The difference is that the United States doesn’t have to worry about the supply. And that is a differentiator.
20% of the world’s oil and liquified natural gas (LNG) passes through the Strait of Hormuz, most of it destined for India and Asia — including China, which imports 70% of its imported oil from the Persian Gulf. That reality can cause interruptions in production. Inflation is also an issue — not just at the gas pump and utility costs, but downstream. Airline tickets will be more expensive because jet fuel is more expensive. Petrochemicals are used in fertilizers, and that will impact planting decisions and food prices.
Higher oil prices are restrictive to economic growth, but the U.S., which is far more energy independent than it has been in the past, should not face many of the problems that plagued the economy in past energy crises.
Important Information
The views expressed represent the opinions of RBC Rochdale, LLC which are subject to change and are not intended as a forecast or guarantee of future results. Stated information is provided for informational purposes only, and should not be perceived as personalized investment, financial, legal or tax advice or a recommendation for any security. It is derived from proprietary and non-proprietary sources which have not been independently verified for accuracy or completeness. While RBC Rochdale believes the information to be accurate and reliable, we do not claim or have responsibility for its completeness, accuracy, or reliability. Statements of future expectations, estimates, projections, and other forward-looking statements are based on available information and management's view as of the time of these statements. Accordingly, such statements are inherently speculative as they are based-on assumptions which may involve known and unknown risks and uncertainties. Actual results, performance or events may differ materially from those expressed or implied in such statements.
All investment strategies have the potential for profit or loss; changes in investment strategies, contributions or withdrawals may materially alter the performance and results of a portfolio. Different types of investments involve varying degrees of risk, and there can be no assurance that any specific investment will be suitable or profitable for a client's investment portfolio.
RBC Rochdale, LLC is an SEC-registered investment adviser and wholly-owned subsidiary of City National Bank. Registration as an investment adviser does not imply any level of skill or expertise. City National Bank is a subsidiary of the Royal Bank of Canada.
© 2026 RBC Rochdale, LLC. All rights reserved.
