
-
Fixed Income Perspectives
Credit Markets Tough Out March Madness
April 2026
- Filename
- Fixed Income Perspectives April 2026.pdf
- Format
- application/pdf

TRANSCRIPT
March brought another month of heightened volatility for fixed-income markets driven by investor concerns over stress in the private credit sector, the potential for AI-driven labor displacement and escalating geopolitical tensions in the Middle East. Together, these crosscurrents added to uncertainty and led to a repricing of central bank policy and inflation expectations.
UST 2-Yr and 10-Yr Yields vs. Fed Funds Upper Bound
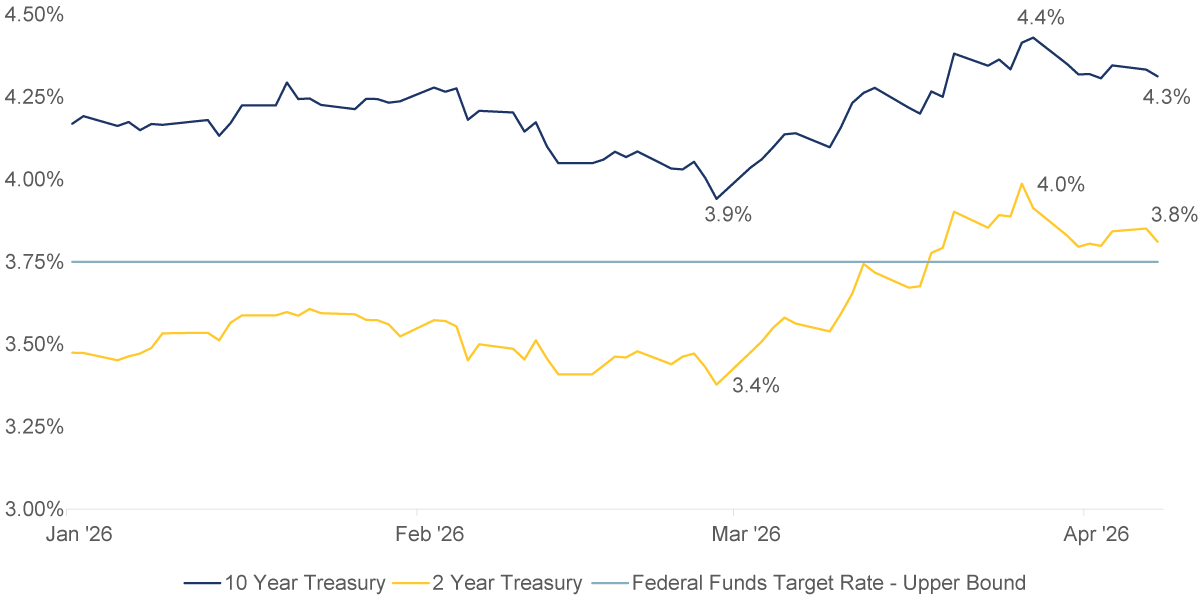
Source: Bloomberg as of 4/7/2026.
Information is subject to change and is not a guarantee of future results.
Chart 1, 0:35– In the U.S., we saw the U.S. Treasury curve flatten meaningfully. Two-year yields tested 4%—moving above the upper bound of the Federal Funds rate—as investors grappled with the effects of the energy price shock from the Iran war. That shift largely erased market-based expectations for rate cuts this year. Longer-term yields also moved higher, though more modestly. Ten-year yields approached 4.5% before pulling back to 4.3% by month-end, reflecting growing concerns about economic growth in an extended Middle East conflict. Overall, Treasury yields increased by 30-45 basis points (bps) across the curve in March.
At its March meeting, the Fed held rates steady at as expected. Updated projections showed upward revisions to both growth and inflation, while the labor market continues to be viewed as resilient and broadly balanced. Importantly, Chairman Powell also signaled a willingness to look past short-term energy price increases, reinforcing market expectations for an extended pause in policy. Despite the inflation risk, we have not changed our view of Fed policy this year, and we continue to expect cuts given weakness in employment. If a resolution with Iran holds, the price impact is likely to be short-lived and the market will return to its focus on AI disruption.
Fixed Income Broad Index Total Returns
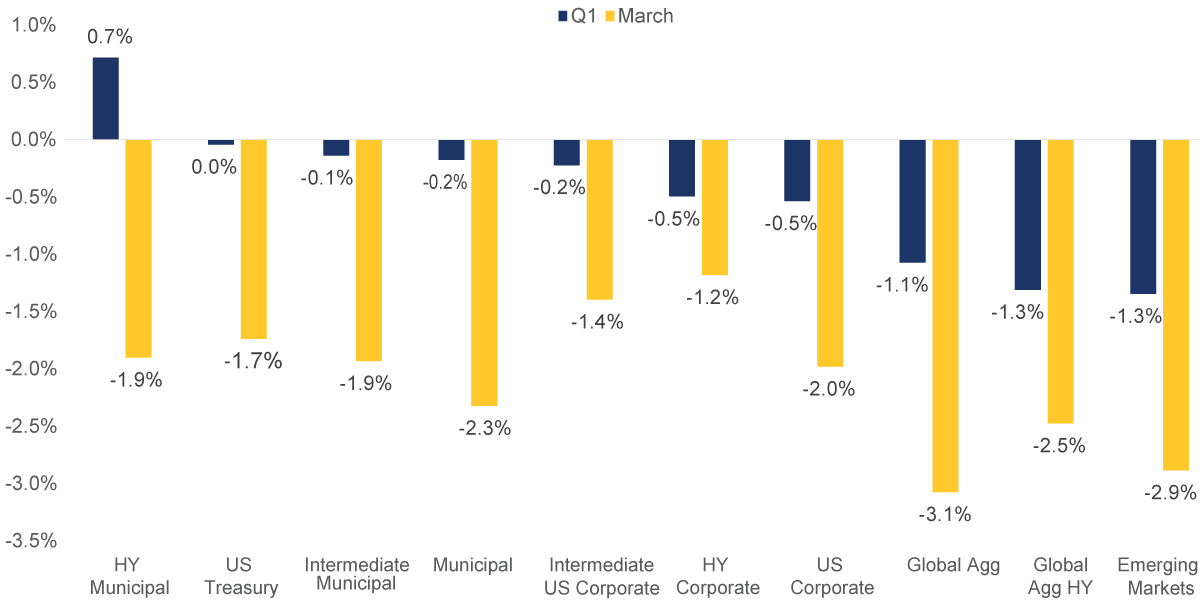
Source: HY Municipal is the Bloomberg Municipal Bond: High Yield (non-Investment Grade) Total Return Index. Municipal is the Bloomberg Municipal Bond Index Total Return Index. Intermediate Municipal is the Bloomberg Municipal Bond Inter-Short 1-10Y TR Index. US Treasury is the Bloomberg US Treasury Total Return Index. Intermediate US Corporate is the Bloomberg Intermediate Corporate Total Return Index. HY Corporate is the Bloomberg US Corporate High Yield Total Return Index. Emerging Markets is the Bloomberg EM USD Aggregate Total Return Index. US Corporate is the Bloomberg US Corporate Total Return Index. Global Agg is the Bloomberg Global-Aggregate Total Return Index. Global AGG HY is the Bloomberg Global High Yield Total Return Index. As of 3/31/2026 .
Past performance is no guarantee of future results and information is subject to change.
Chart 2, 1:58– Market volatility weighed on fixed income performance in March, pushing year-to-date returns into negative territory. The primary driver was the sharp rise in yields, alongside modest downdrafts in credit-sensitive sectors and a stronger U.S. dollar, which pressured global bonds. Despite these headwinds, corporate credit held up relatively well. While the initial escalation of geopolitical tensions triggered spread widening—with investment-grade credits edging modestly wider and high-yield bonds experiencing a more pronounced reaction—this proved short-lived.
Credit Spread Volatility Subsides
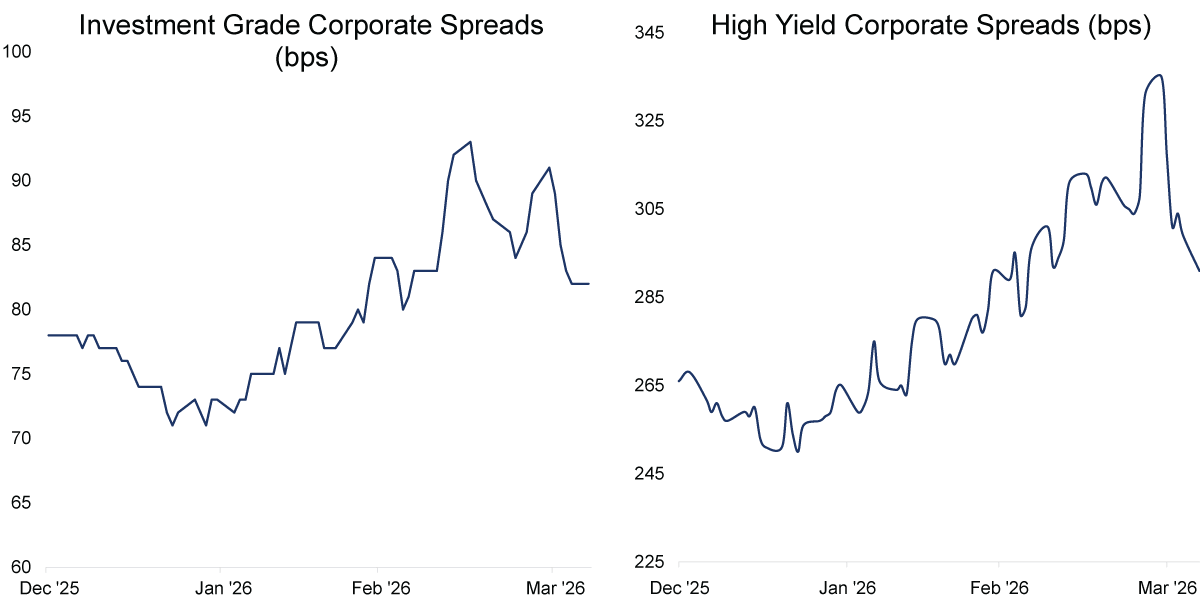
Source: Investment Grade – Bloomberg US Agg Corporate Average OAS Index as of 4/7/2026. High Yield– Bloomberg US Corporate High Yield Average OAS Index as of 4/7/2026.
Information is subject to change and is not a guarantee of future results.
Chart 3, 2:23– By month-end, spreads had largely retraced to pre-conflict levels and remained tight relative to long-term averages. Overall, this dynamic reflects a normalization in risk pricing driven by higher rates and increased volatility rather than a deterioration in underlying credit fundamentals.
Yields, Up, Value Opportunities Surface
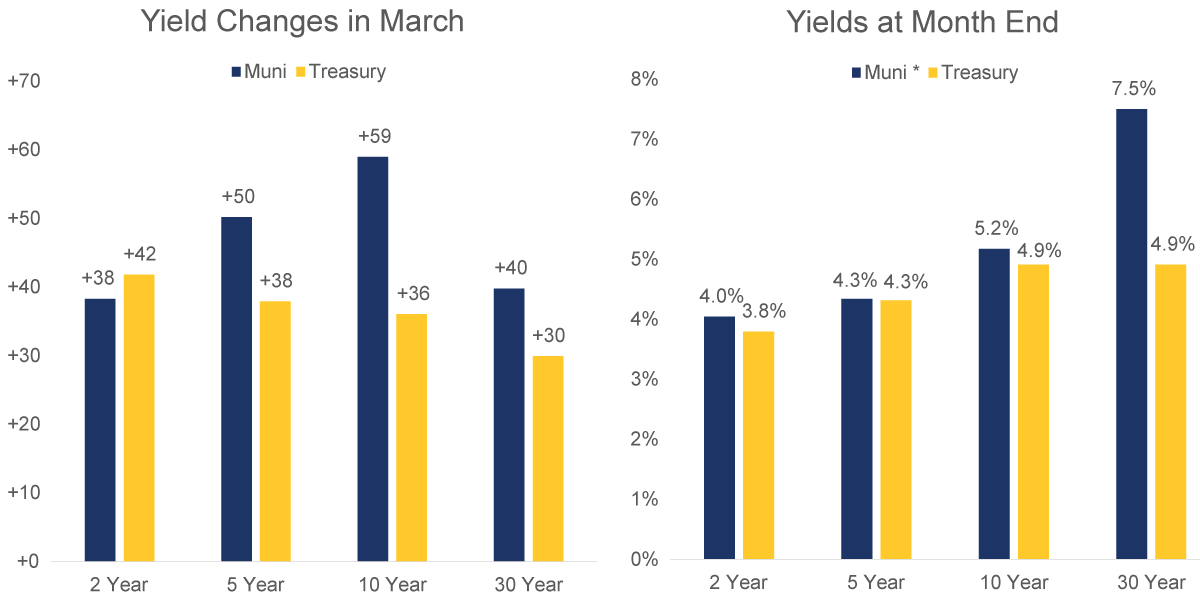
Source: Treasury – Bloomberg US Treasury Actives Curve as of 3/31/2026. Muni – Bloomberg BVAL Municipal AAA Yield Curve (Callable) as of 3/31/2026. *Tax Equivalent Yield - Assumes 37% Federal Tax and 3.8% Medicare surcharge
Information is subject to change and is not a guarantee of future results.
Chart 4, 2:52– Despite a strong start to the year, the municipal market was not immune to broader Treasury volatility. Municipals sold off across the curve, with benchmark yields rising 40-60 bps—outpacing the move in Treasuries. The 5- to 10-year part of the curve was the weakest performer, reflecting a needed repricing after a strong rally that began late last year. Importantly, this reset has improved valuations meaningfully, and taxable equivalent yields look attractive for high-quality paper where credit fundamentals remain strong. As a result, municipals appear better positioned moving forward, especially if market volatility persists.
To bring this together, fixed-income markets are currently navigating crosscurrents between inflation risks and slowing economic growth. Our base case remains that energy serves as the primary transmission mechanism for these dynamics, with the duration and magnitude of the Iran conflict being critical determinants of the global economic impact. We are encouraged by the ceasefire negotiations, but remain cautious on the war’s long-term conclusion. While geopolitical risk has created noise, we do not see indications of systemic stress and the credit market behavior reinforces this view. The recent volatility appears driven by rate sensitivity rather than fundamental credit deterioration.
Looking ahead, we anticipate the 10-year U.S. Treasury yield to range between 3.75% and 4.25%, with the Federal Reserve likely to remain on hold until the second half of 2026. However, the Fed remains data-dependent and patient, and we continue to see a plausible path toward lower rates later in the year. Despite higher yields, credit markets have demonstrated stability, creating opportunities across fixed income— especially in the municipal bond market. Our recommendation: Stay on course with your investment strategy.
Important Information
The views expressed represent the opinions of RBC Rochdale, LLC which are subject to change and are not intended as a forecast or guarantee of future results. Stated information is provided for informational purposes only, and should not be perceived as personalized investment, financial, legal or tax advice or a recommendation for any security. It is derived from proprietary and non-proprietary sources which have not been independently verified for accuracy or completeness. While RBC Rochdale believes the information to be accurate and reliable, we do not claim or have responsibility for its completeness, accuracy, or reliability. Actual results, performance or events may differ materially from those expressed or implied in such statements.
All investing is subject to risk, including the possible loss of the money you invest. As with any investment strategy, there is no guarantee that investment objectives will be met, and investors may lose money. Diversification does not ensure a profit or protect against a loss in a declining market. Past performance is no guarantee of future performance.
RBC Rochdale, LLC is an SEC-registered investment adviser and wholly-owned subsidiary of City National Bank. Registration as an investment adviser does not imply any level of skill or expertise. City National Bank is a subsidiary of the Royal Bank of Canada.
Fixed Income investing strategies & products. There are inherent risks with fixed income investing. These risks include, but are not limited to, interest rate, call, credit, market, inflation, government policy, liquidity or junk bond risks. When interest rates rise, bond prices fall. This risk is heightened with investments in longer-duration fixed income securities and during periods when prevailing interest rates are low or negative.
High yield securities. Investments in below-investment-grade debt securities, which are usually called “high yield” or “junk bonds,” are typically in weaker financial health. Such securities can be harder to value and sell, and their prices can be more volatile than more highly rated securities. While these securities generally have higher rates of interest, they also involve greater risk of default than do securities of a higher-quality rating.
© 2026 RBC Rochdale, LLC. All rights reserved.
Index Definitions:
Bloomberg Muni and Treasury Yield Curves are graphical representations showing the relationship between interest rates (yields) and time to maturity for tax-exempt municipal bonds and taxable U.S. Treasury securities, respectively.
Bloomberg US Treasury Index measures the performance of U.S. dollar-denominated, fixed-rate, nominal debt issued by the U.S. Treasury, excluding Treasury bills, inflation-linked bonds, and STRIPS. It includes public obligations with at least one year remaining to maturity and is a key component of the broader Bloomberg Aggregate Index.
Bloomberg Municipal Bond Index is a rules-based, market-value-weighted index that measures the performance of the USD-denominated, investment-grade, long-term tax-exempt bond market.
Bloomberg Intermediate US Treasury Index measures the performance of U.S. dollar-denominated, fixed-rate, nominal debt issued by the U.S. Treasury with a remaining maturity of 1 to 10 years.
Bloomberg Short US Treasury Index measures the performance of U.S. dollar-denominated, fixed-rate, nominal debt issued by the U.S. Treasury with a remaining maturity of less than one year (specifically 1 month up to 1 year).
Bloomberg Short Municipal Bond Index is a market value-weighted index tracking investment-grade, tax-exempt U.S. municipal bonds with short-term maturities, typically ranging from one to five years.
