Insights
Q1 2025 Equity Market Themes and Recap
April 29, 2025


Key Points:
- Stagflationary Pressures: The combination of slowing economic growth (Q1 GDP forecast at just 0.3%) alongside persistent inflation (Core PCE at 2.9%) created a challenging environment for equities.
- Trade Policy Disruption: The Trump administration’s implementation of sweeping tariffs, including 25% on Canada and Mexico and 20% on China, triggered market volatility and supply chain disruptions.
- Sector Rotation: A significant revaluation of AI-related stocks, defensive positioning in consumer sectors and healthcare policy shifts led to pronounced performance divergence across equity sectors.
The first quarter of 2025 presented significant challenges for equity markets, with several key themes driving market performance. Following the strong returns seen in 2024, Q1 2025 marked a notable shift in investor sentiment and market dynamics. The S&P 500 declined 4.3% during the quarter, its first quarterly decline since Q3 2023, as markets grappled with complex economic and policy developments.
Stagflationary Concerns
The quarter was characterized by mounting fears of stagflation — a challenging economic scenario in which slowing growth coexists with persistent inflation. Economic growth slowed dramatically, with Q1 GDP growth forecasts falling to just 0.3%, compared to 2.3% in Q4 2024, marking the weakest growth since 2022. This deceleration came as Core PCE inflation remained stubbornly above the Federal Reserve’s 2% target, hovering around 2.9% during the quarter. The combination created a dilemma for the Federal Reserve, limiting its ability to stimulate growth amid ongoing price pressures.
Consumer sentiment plummeted to its lowest level since 2021, with the University of Michigan survey showing two-thirds of consumers expecting rising unemployment in the year ahead. This decline in confidence, coupled with elevated inflation expectations, further reinforced stagflationary concerns. The risk of stagflation put particular pressure on cyclical stocks that had previously led market advances, as investors questioned the sustainability of corporate earnings growth.
Chart 1: US Equity Markets Anticipate Growing Stagflation
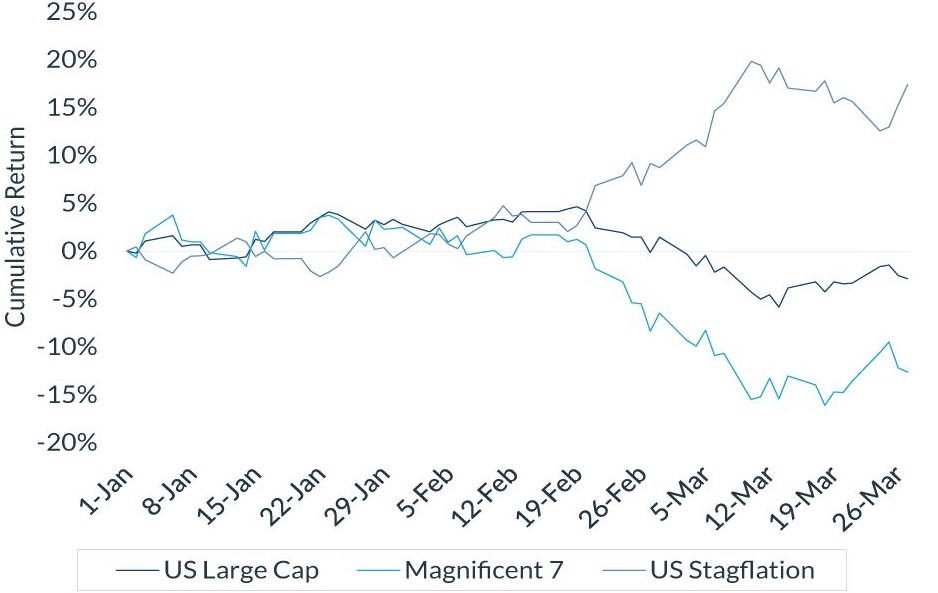
Source: Bloomberg, as of March 27, 2025. Past performance is no guarantee of future results.
US Large Cap is the S&P 500 Index. Magnificent 7 isThe Bloomberg Magnificent Seven Total Return Index. Indexes are unmanaged and do not reflect a deduction for fees or expenses. Investors cannot invest directly in an index. Information is subject to change and is not a guarantee of future results.
Tariff Policy and Trade Tensions
President Donald Trump’s aggressive trade policies became a significant market disruptor during the quarter. The administration implemented 25% tariffs on goods from Canada and Mexico, while tariffs on Chinese imports increased to 20%, effective March 4. These moves, justified on national security and border control grounds, represented the most substantial trade policy shift since Trump’s first term.
The tariff announcements triggered a 10% peak-to-trough S&P 500 correction, with particularly severe impacts on multinational corporations dependent on global supply chains. Companies across sectors reported significant challenges in their earnings calls, with mentions of “tariffs” in quarterly reports increasing 190% quarter-over-quarter. Markets remained on edge throughout the quarter as the April 2 deadline for additional “reciprocal tariff” announcements loomed, creating uncertainty that weighed on equities.
The trade tensions extended beyond North America and China, with threats of tariffs against the European Union further complicating the global trade landscape. Sectors with significant international exposure, including technology, industrials and consumer discretionary, experienced the greatest volatility in response to tariff developments.
AI Sector Revaluation
The artificial intelligence sector, which had been a powerful market driver in 2024, faced a significant revaluation in Q1. Chinese AI company DeepSeek released a remarkably cost-efficient AI model that required significantly fewer computational resources than those of U.S. competitors. This development called into question the massive infrastructure investments made by U.S. tech companies and sparked concerns about the sustainability of their spending.
The technology leaders that had dominated market returns in 2024 experienced a notable pullback, with the Bloomberg Magnificent Seven Total Return Index falling 16% year-to-date by the end of March. Nvidia, the chipmaker at the center of the AI boom, saw particular volatility as investors questioned whether future AI models would require the same level of computational intensity that had driven demand for its advanced chips.
Concerns about escalating costs and uncertain returns led investors to reassess the lofty valuations that had been assigned to AI-related companies. While the long-term potential of AI remained undisputed, the quarter saw a more nuanced view emerge regarding the timeline and capital requirements for realizing that potential, leading to a significant rotation away from the sector that had previously led the market.
Healthcare Policy Shifts
The new Trump administration’s healthcare policy initiatives had measurable impacts on the sector during Q1. The administration moved quickly to implement changes to ACA Marketplace enrollment processes, price transparency requirements and reform of pharmacy benefit managers. These regulatory shifts created both opportunities and challenges within the healthcare sector.
Proposals to direct more Medicare beneficiaries toward Medicare Advantage plans benefited insurers but raised concerns about long-term implications for traditional Medicare. The sector also faced uncertainty regarding the administration’s approach to the Inflation Reduction Act’s drug pricing provisions, particularly the negotiation program set to expand in February with the second set of up to 15 drugs subject to Medicare price negotiations.
Despite these policy uncertainties, certain healthcare subsectors demonstrated resilience. Companies involved in weight-loss drug development, such as Eli Lilly and Novo Nordisk, continued to attract investor interest due to the expanding addressable market for these treatments. The healthcare sector’s defensive characteristics also provided some insulation from broader market volatility.
Consumer Weakness
A notable divergence between labor data and consumer sentiment characterized the quarter. Despite relatively stable unemployment figures around 4.1%*, consumer confidence measures declined for four consecutive months, reflecting growing economic anxiety among households. The combination of inflation pressures and tariff-related price increases raised concerns about the sustainability of consumer spending, which had previously been a pillar of economic resilience.
Retail sales data showed signs of moderation, particularly in discretionary categories, as consumers became more cautious with their spending. This weakening consumer outlook had significant implications for earnings expectations across multiple sectors and contributed to the outperformance of consumer staples relative to consumer discretionary stocks.
The housing sector, which had anticipated benefits from the Federal Reserve’s expected easing cycle, faced headwinds from persistent mortgage rates and affordability challenges. Home improvement retailers like Home Depot and Lowe’s experienced pressure as consumers delayed large renovation projects amid economic uncertainty.
U.S. Market Underperformance
A striking development in Q1 was the underperformance of U.S. equities relative to global peers. The S&P 500 experienced a 10% correction from February highs before staging a partial recovery late in the quarter. This correction represented the most significant drawdown since 2022 and marked a departure from the U.S. market’s previous leadership.
Non-U.S. markets benefited from weaker dollar expectations and generally less exposure to tariff concerns. This global divergence represented a significant shift from the U.S.-dominated returns that had characterized much of 2024. The relative strength of international markets suggested a potential rotation in global asset allocation as investors reassessed geographic exposures.
Fixed income markets reflected the changing economic landscape, with the U.S. 10-year Treasury yield dropping 60 basis points to 4.2% during the quarter as investors sought safety amid equity market volatility. This flight to quality further emphasized the risk-off sentiment that pervaded markets for much of the quarter.
Equity Market Recap
The overall equity market performance in Q1 reflected these complex crosscurrents. The S&P 500’s 4.3% decline was accompanied by elevated volatility, with the VIX index experiencing elevated levels in March. Sector performance diverged significantly, with consumer staples, utilities and healthcare demonstrating relative resilience while technology, industrials and consumer discretionary sectors faced the strongest headwinds.
Despite the challenging quarter, market analysts maintained a non-recessionary base case for 2025, expecting potential stabilization as trade policy uncertainties diminish and companies adapt to the changing economic landscape. The quarter concluded with markets awaiting clarity on several fronts, including the Federal Reserve’s response to persistent inflation amid slowing growth, details of tariff implementation and corporate earnings impacts from these macroeconomic shifts.
Chart 2: Rolling 4-Week Returns
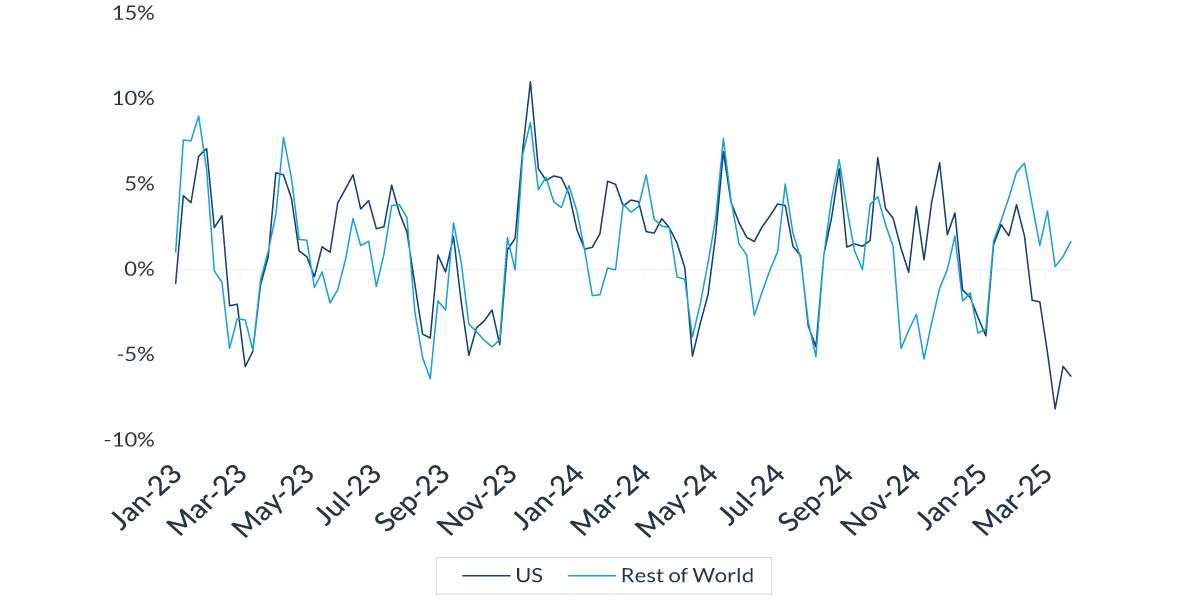
Source: Bloomberg, as of March 28, 2025. Past performance is no guarantee of future results.
Indexes used: US – Russell 3000 Index. Rest of World – MSCI ACWI ex USA Index.
* Source: Bureau of Labor Statistics, as of 3/7/2025.
Important Information
The views expressed represent the opinions of City National Rochdale, LLC (CNR) which are subject to change and are not intended as a forecast or guarantee of future results. Stated information is provided for informational purposes only, and should not be perceived as personalized investment, financial, legal or tax advice or a recommendation for any security. It is derived from proprietary and non-proprietary sources which have not been independently verified for accuracy or completeness. While CNR believes the information to be accurate and reliable, we do not claim or have responsibility for its completeness, accuracy, or reliability. Statements of future expectations,estimates, projections, and other forward-looking statements are based on available information and management’s view as of the time of these statements. Accordingly, such statements are inherently speculative as they are based on assumptions which may involve known and unknown risks and uncertainties. Actual results, performance or events may differ materially from those expressed or implied in such statements.
All investing is subject to risk, including the possible loss of the money you invest. As with any investment strategy, there is no guarantee that investment objectives will be met, and investors may lose money. Diversification may not protect against market risk or loss. Past performance is no guarantee of future performance.
© 2025 City National Bank. All rights reserved.
Index Definitions
S&P 500 Index: The S&P 500 Index, or Standard & Poor’s 500 Index, is a market-capitalization-weighted index of 500 leading publicly traded companies in the US It is not an exact list of the top 500 US companies by market cap because there are other criteria that the index includes.
Bloomberg Municipal Bond Index: The Bloomberg US Municipal Bond Index measures the performance of investment grade, US dollar-denominated, long-term tax-exempt bonds.
Bloomberg Municipal High Yield Bond Index: The Bloomberg Municipal High Yield Bond Index measures the performance of non-investment grade, US dollar-denominated, and non-rated, tax-exempt bonds.
Bloomberg Investment Grade Index: The Bloomberg US Investment Grade Corporate Bond Index measures the performance of investment grade, corporate, fixed-rate bonds with maturities of one year or more.
The Bloomberg Magnificent 7 Total Return Index: Bloomberg Magnificent 7 Total Return Index is an equal-dollar weighted equity benchmark consisting of a fixed basket of 7 widely-traded companies classified in the United States and representing the Communications, Consumer Discretionary and Technology sectors as defined by Bloomberg Industry Classification System (BICS).
Nasdaq is a global electronic marketplace for buying and selling securities. Its name was originally an acronym for the National Association of Securities Dealers Automated Quotations.
The Dow Jones Industrial Average (DJIA) tracks thirty of America’s biggest and most established companies, acting like a quick temperature check of the U.S. economy.
The MSCI USA Large Cap Index is designed to measure the performance of the large cap segments of the US market. The index covers approximately 70% of the free float-adjusted market capitalization in the US.
The Bloomberg Investment Grade Corporate Bond Spreads refer to the spreads between investment grade, fixed-rate, taxable corporate bonds.
BVAL Municipal AAA Benchmark is a municipal bond benchmark. It provides a 5% coupon benchmark yield curve for high-quality US municipal bonds with an average rating of “AAA” from Moody’s and S&P.
The 10-year BVAL AAA municipal treasury index compares the yield on a AAA rated municipal bond to that of a Treasury before factoring in the effect of taxes.
The Morningstar LSTA US Leveraged Loan 100 Index is designed to measure the performance of the 100 largest facilities in the US leveraged loan market.
The ICE BofA Diversified High Yield US Emerging Markets Corporate Plus Index tracks the performance of US dollar denominated below investment grade emerging markets non-sovereign debt publicly issued in the major domestic and eurobond markets.
The Palmer Square CLO Senior Debt Index is a rules-based observable pricing and total return index for CLO debt for sale in the United States, rated at the time of issuance as AAA or AA (or an equivalent rating).
The Russell 3000 is a broad equity index composed of the 3,000 largest U.S. listed stocks, representing more than 95% of the investable American stock market.
The MSCI ACWI ex USA Index captures large and mid cap representation across Developed Markets (DM) countries (excluding the US) and Emerging Markets (EM) countries. The index covers approximately 85% of the global equity opportunity set outside the US.
Definitions
The “core” Personal Consumption Expenditures (PCE) price index is defined as prices excluding food and energy prices. The core PCE price index measures the prices paid by consumers for goods and services without the volatility caused by movements in food and energy prices to reveal underlying inflation.
A leveraged loan is a type of loan that is extended to companies or individuals that already have considerable amounts of debt or poor credit history.
Yield to worse (YTW) is the lowest potential yield that an issuer can pay on a bond without defaulting.
The Magnificent 7 refers to a group of major tech companies with stock growth that far outpaced the high-performing S&P 500 in recent years. Coined in 2023, the group consists of Alphabet, Amazon, Apple, Meta Platforms, Microsoft, Nvidia, and Tesla.
© 2025 City National Bank. All rights reserved.
Non-deposit investment Products are: • not FDIC insured • not Bank guaranteed • may lose value
Stay Informed.
Get our Insights delivered straight to your inbox.
More from the Quarterly Update
Put our insights to work for you.
If you have a client with more than $1 million in investable assets and want to find out about the benefits of our intelligently personalized portfolio management, speak with an investment consultant near you today.
If you’re a high-net-worth client who's interested in adding an experienced investment manager to your financial team, learn more about working with us here.