
-
Economic Perspectives
Mid Year Review
June 2025
- Filename
- Economic Perspectives June 2025.pdf
- Format
- application/pdf

TRANSCRIPT
We’re at this year’s midpoint, so it’s a good idea to take a step back and review how the economy has progressed.
Fortunately, the economy is not nearly as sensitive as the financial markets have been, so performance has not been as volatile as what we have seen in various financial markets both domestically and internationally.
That said, some important changes have occurred that can alter the trajectory of some parts of the economy. The good news is that the economy did start the year off on a very healthy and robust place. The unemployment rate in January was just a very low 4%.
Consumer spending, which is 2/3rds of GDP, had grown at a strong pace of 4% in the 4th quarter and 3.1% for all of 2024. Income grew faster than inflation. Household and corporate balance sheets were healthy.
So, let’s take a look at some of the charts.
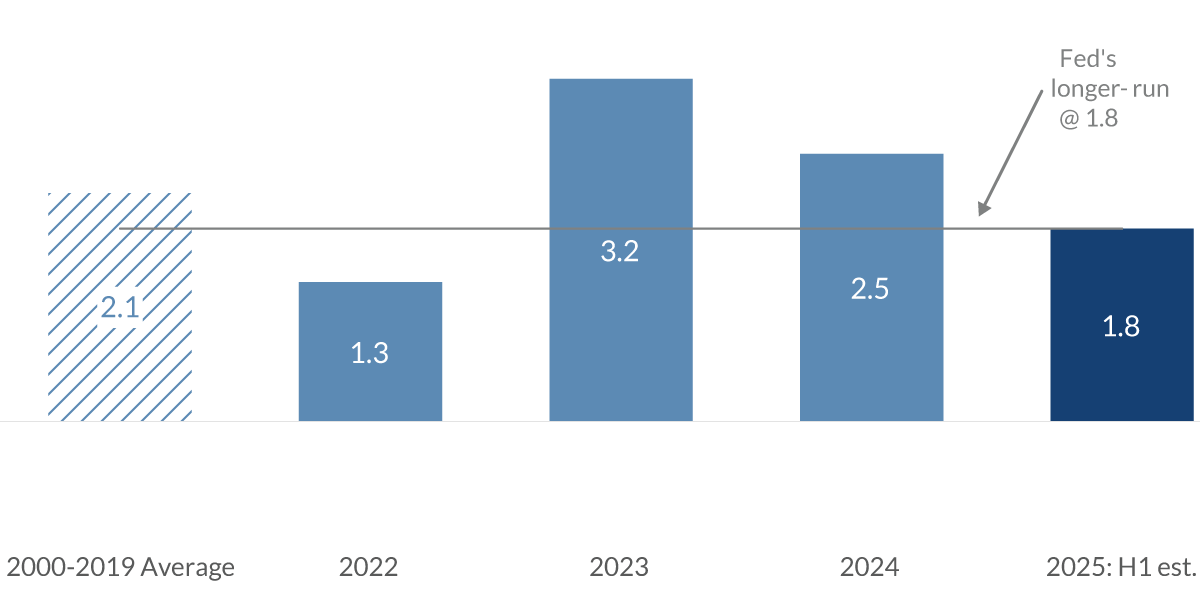
GDP
%, seasonally adjusted annual rate
2025: H1 estimate based on average of actual Q1 GDP and June 24 Atlanta Fed GDPNow Q2 forecast
Data current as of June 24, 2025
Source: Bureau of Economic Analysis
Information is subject to change and is not a guarantee of future results.
Chart 1, 1:13– This first chart is GDP. Since all the charts in the presentation are the same format, let me explain the setup.
The first column with the diagonal lines on the far left is a long-term average, which gives some perspective on recent performance. It covers 20 years from 2000 to 2019, avoiding the pandemic year of 2020.
The following three columns in light blue are the most recent full years. They avoid the bounce-back year of 2021.
On the far right in dark blue is the performance for this year.
With this chart, we’re looking at GDP, the broadest measure of domestic economic growth. In this case, we are looking at the expected increase for the first half of 2025. This is an estimate based on the published growth rate in the first quarter of a negative 0.2 of 1% and the Atlanta Fed’s current estimate for second quarter growth, which is 3.4%.
We’re doing this because of the quirkiness of the first quarter data. Back in the first quarter, record-setting imports occurred as domestic importers rushed to get goods into the country before the expected tariffs were implemented. In GDP accounting, imports are a negative. Once those imports are put into inventory, that is an equally offsetting positive.
A complete transfer did not happen in the first quarter, but will probably occur in the second quarter, which is represented in the Atlanta Fed’s strong forecast. As you can see in this chart, the 1.6% pace of growth in the first half of this year is a little slower than what we have seen in the past few years, and it’s also slower than the longer-term period.
And it’s just below what the Fed’s view as a sustainable pace of 1.8%. This is the pace that the Fed believes will keep the unemployment rate and inflation rate low and stable. The main reason for the slower pace of growth in the first half of this year is the moderation in consumer spending, and I’ll discuss that in greater detail in a few minutes.
Unemployment Rate
%, seasonally adjusted - as of May 2025
Data current as of June 24, 2025
Source: Bureau of Labor Statistics
Information is subject to change and is not a guarantee of future results.
Chart 2, 3:26– This chart shows the unemployment rate, which has averaged just 4.1% this year, a tad higher than the past three years, but well below the long-term average of 6.9%. The good news is that the rate is still within the band of what many economists view as full employment, somewhere between 4 and 4.5%.
Although the unemployment rate has been on an upward trajectory for two years since hitting a cycle lower 3.4% back in 2023, which was an unsustainably low number, it is important to note that historically speaking, the current 4.2% is still a really low number.
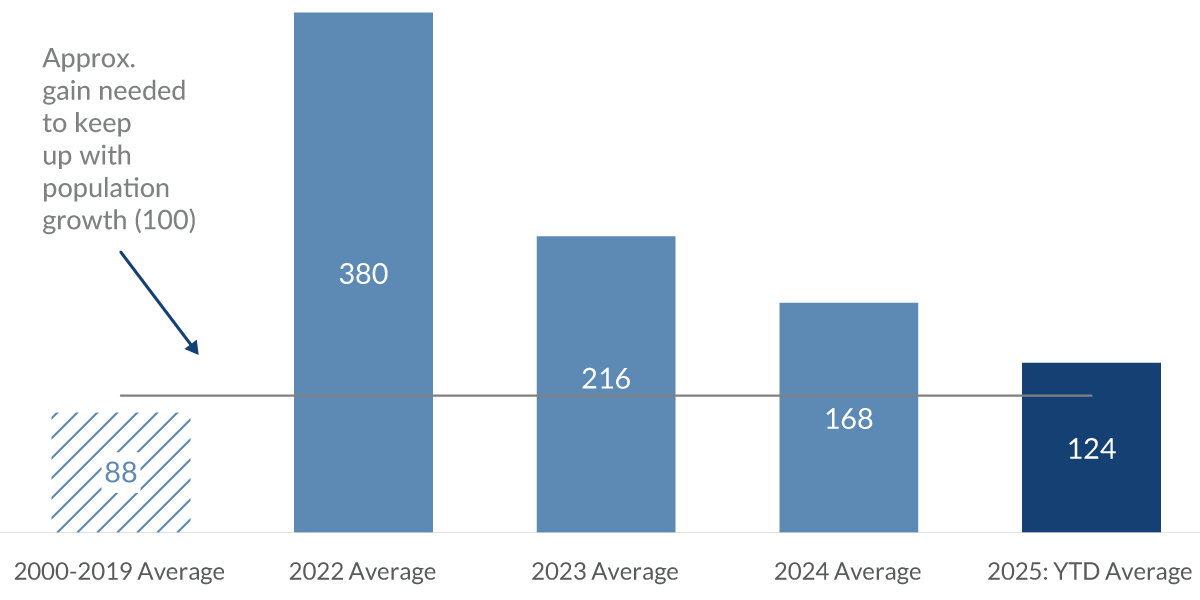
Nonfarm Payrolls: Monthly Change
'000, seasonally adjusted - as of May 2025
Data current as of June 24, 2025
Source: Bureau of Labor Statistics
Information is subject to change and is not a guarantee of future results.
Chart 3, 4:06– In a separate measure of labor demand, the change in payroll growth has declined somewhat this year. The growth rate has averaged just 124,000, slower than the past three years but above the longer-term average. The slowing pace of growth in the past few years is consistent with past economic expansions.
Demand for workers tends to be very strong coming out of a recession, but tapers as economic growth returns to a more sustainable pace of growth. The critical issue here is that the pace of growth is above that 100,000 new job level. That’s the number that economists believe is the average number of new jobs needed to employ new people that are coming into the workforce.
The health of the labor market is essential for continued economic growth. So far this year, the labor market has been sturdy with more than 600,000 people hired in the first five months.
But we are constantly looking for possible changes. The best measurement for this is the weekly report from the Department of Labor, which measures the unemployed workers’ initial claim for unemployment insurance. Economists view this as the canary in the coal mine because it quickly detects changes in labor demand. It’s timely. It’s released weekly on Thursday mornings and is based on data from the previous week.
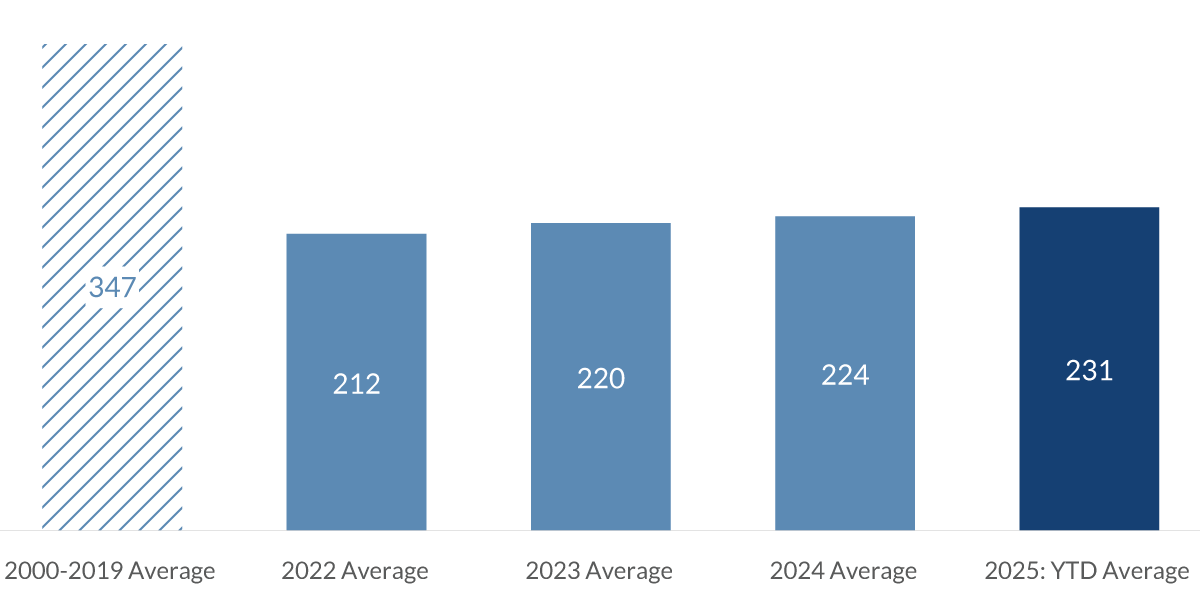
Initial Claims for Unemployment Insurance
'000, seasonally adjusted - as of May 2025
Data current as of June 24, 2025
Source: The Labor Department
Information is subject to change and is not a guarantee of future results.
Chart 4, 5:29– Here you can see the number of people making their initial claim for unemployment insurance, and it’s averaging 231,000. It’s well below the longer-term average. The range in the past few years has been near record lows with data going back about 60 years, and it reflects the strong economy and the demand for workers.
Our view on the labor market is that it will remain healthy. Although the pace of hiring has moderated as economic growth has downshifted, businesses are in no hurry to lay off workers.
Part of that might be a lesson from the recent pandemic. Back then, companies quickly laid off workers. Twenty-two million people lost their job in two months, and that was due to the uncertainty of the economic outlook of the business managers.
But the economy continued to press forward, and they had troubles hiring back staff. And when they did, the cost was higher. We think businesses are in a wait and see mode, waiting for the tariffs to be decided and looking forward to growth opportunities once the administration focuses on reducing regulation.
CPI
%, average of monthly data - as of May 2025
Data current as of June 24, 2025
Source: Bureau of Labor Statistics
Information is subject to change and is not a guarantee of future results.
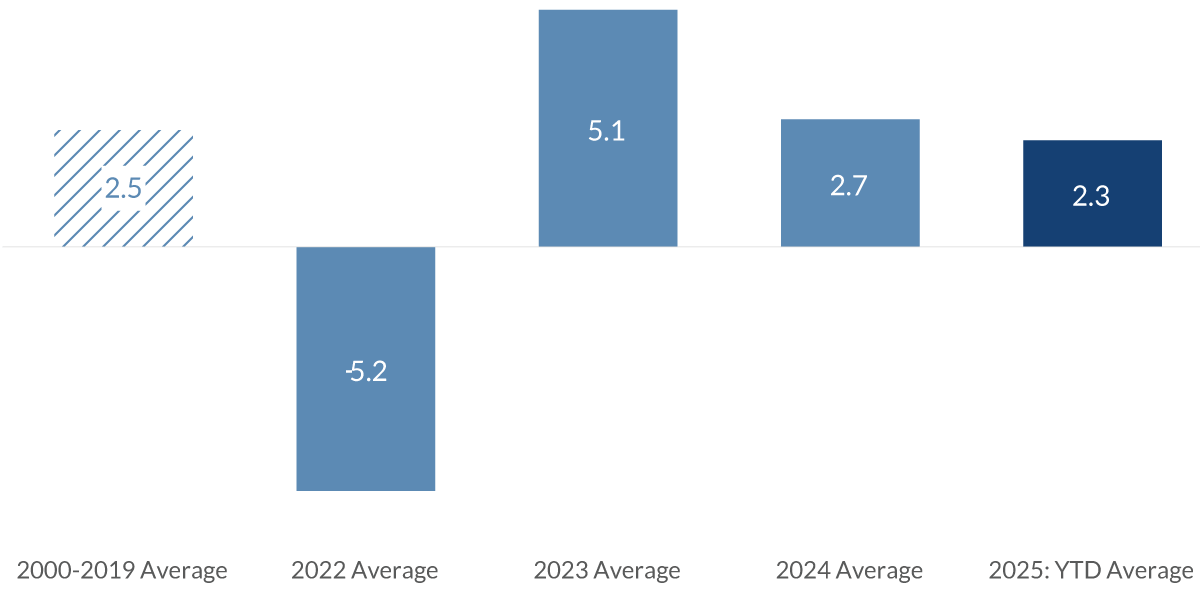
Chart 5, 6:35– To us, financial stability and strength are paramount in terms of importance. This chart measures household income after paying taxes and adjusting for inflation.
Here, the annualized growth rate is about equal to the long-term average. But you can see in the last few years, it’s been volatile. In 2022, it was negative. People earned less than the inflation rate. That was the year of high inflation when CPI hit 9.1%.
Disposable Personal Income
income after taxes, adjusted for inflation
% annualized change - as of April 2025
Data current as of June 24, 2025
Source: Bureau of Economic Analysis
Information is subject to change and is not a guarantee of future results.
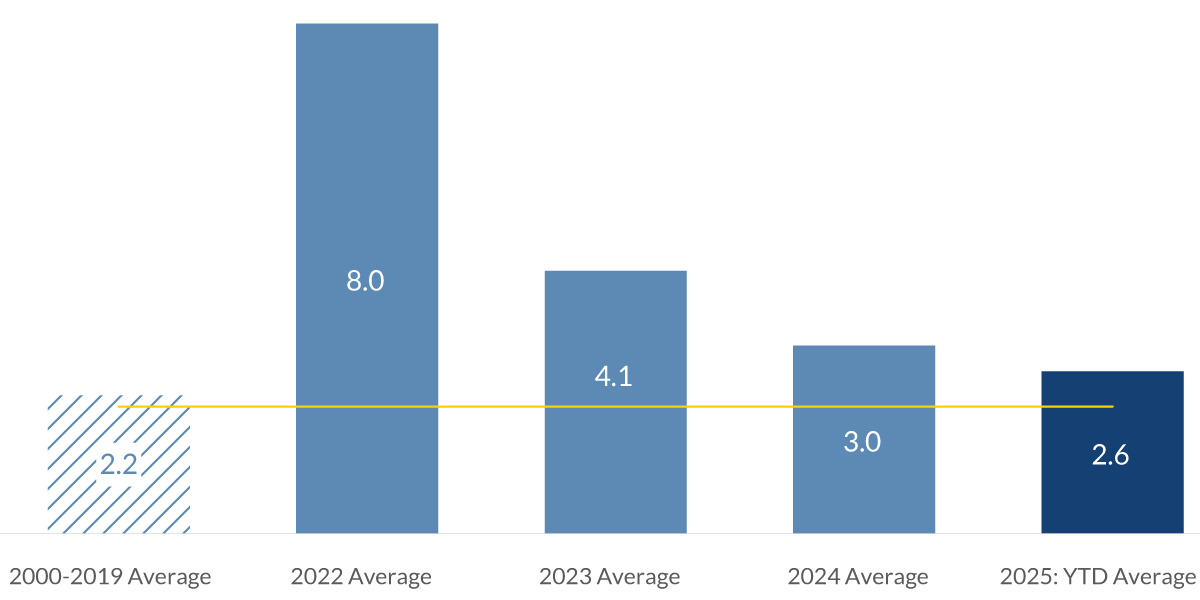
Chart 6, 7:50– In this chart of the consumer price index, you can see the spike in inflation in 2022. But this year’s annual rate is close to the long-term average of 2.2%, but it’s still ahead of the Fed’s target of 2%.
With inflation, the trend is our friend, and it has been on a downward trend so far this year. CPI in the last three months has increased at an annualized rate of just 1%. That said, it is expected to move up over the remainder of the year due to the increase in the tariffs.
Back in 2018, when a 25% tariff was put on Chinese washing machines, the price didn’t increase until about three or four months later.
Personal Spending: Inflation Adjusted
% change - as of April 2025
Data current as of June 24, 2025
Source: Bureau of Economic Analysis
Information is subject to change and is not a guarantee of future results.
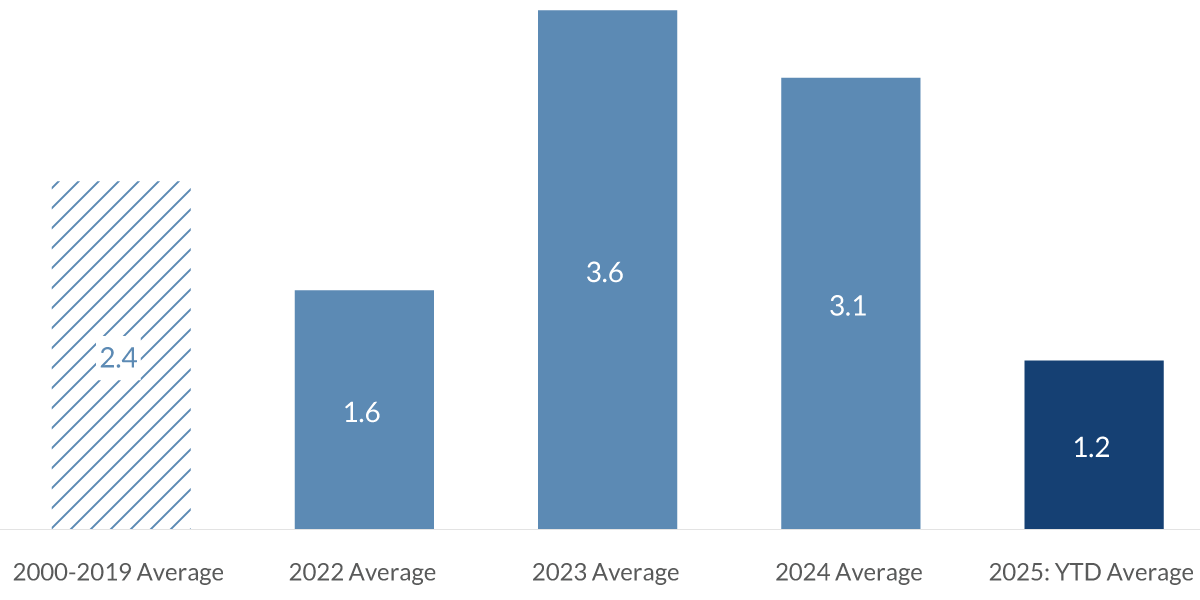
Chart 7, 4:06– This brings us to spending. In this chart, you can see how spending has slowed this year compared to the past. The first two months of this year were slow due to the severe weather and fires in Los Angeles, which slowed demand.
Since then, the uncertainty of various government policies, especially regarding tariffs, has kept demand low. We expect stability in economic policy over the remainder of the year and will bring back stronger spending, especially in the fourth quarter, because the slower spending that has occurred so far meant an increase in savings. If consumers are comfortable with their outlook, they will use that money and spend it. There are other economic issues, which include housing, which remains expensive and is not expected to contribute much to GDP growth this year. We’re also watching closely the manufacturing sector, which has been flat for the past couple of years. But with some changes, we might see some positive movement this year.
As we look into the future, our view is that the pace of economic growth will be slower this year compared to the past few years, but there will not be a recession. The slower pace of growth is mainly due to the high level of uncertainty that consumers have regarding the federal government’s economic policies.
That uncertainty should subside in the next month or two as tariff rates are negotiated and the budget for next year should be approved. With both of those in the rearview mirror, the administration will focus on reducing regulations, a very pro-business move that should push the pace of growth in the latter half of this year and well into next year.
Important Information
The information presented does not involve the rendering of personalized investment, financial, legal, or tax advice. This presentation is not an offer to buy or sell, or a solicitation of any offer to buy or sell any of the securities mentioned herein.
Certain statements contained herein may constitute projections, forecasts and other forward-looking statements, which do not reflect actual results and are based primarily upon a hypothetical set of assumptions applied to certain historical financial information. Viewers are cautioned that such forward-looking statements are not a guarantee of future results, involve risks and uncertainties, and actual results may differ materially from those statements. Certain information has been provided by third-party sources and, although believed to be reliable, it has not been independently verified and its accuracy or completeness cannot be guaranteed.
Any opinions, projections, forecasts, and forward-looking statements presented herein are valid as of the date of this video’s distribution and are subject to change.
Past performance or performance based upon assumptions is no guarantee of future results.
All investing is subject to risk, including the possible loss of the money you invest. As with any investment strategy, there is no guarantee that investment objectives will be met and investors may lose money. Diversification does not ensure a profit or protect against a loss in a declining market.
City National Rochdale, LLC is an SEC-registered investment adviser and wholly-owned subsidiary of City National Bank. Registration as an investment adviser does not imply any level of skill or expertise. City National Bank is a subsidiary of the Royal Bank of Canada.
© 2025 City National Bank. All rights reserved.
NON-DEPOSIT INVESTMENT PRODUCTS ARE: • NOT FDIC INSURED • NOT BANK GUARANTEED • MAY LOSE VALUE
Stay Informed.
Get our Insights delivered straight to your inbox.
Check out previous perspectives:


Put our insights to work for you.
If you have a client with more than $1 million in investable assets and want to find out about the benefits of our intelligently personalized portfolio management, speak with an investment consultant near you today.
If you’re a high-net-worth client who's interested in adding an experienced investment manager to your financial team, learn more about working with us here.
