
Videos › Economic Perspectives › January 2026
-
Economic Perspectives
Import Economic Issues for 2026
January 2026
- Filename
- Economic Perspectives January 2026.pdf
- Format
- application/pdf

TRANSCRIPT
With the new year just underway, we decided to look at some of the key economic issues the economy is dealing with this year.
Many headlines raise investor fears, but we believe the economy is strong enough to weather the storm, just like it has for the past few years with other worries: the post-pandemic fear of office real estate plummeting in value, the Russia-Ukraine war in 2022, and the Fed raising interest rates in 2022 and 2023, which caused the yield curve to invert and tends to precede recessions. There were also a couple of significant bank failures in 2023, and, of course, last year’s trade conflict. In all cases, the U.S. economy continued to power forward.
So, let’s look at some charts on macroeconomic issues.
GDP: Actual & Forecast (Bloomberg Survey of Forecasts)
% change, seasonally adjusted annualized rate
Data current as of January 20, 2026.
Source: Bureau of Labor Statistics
Information is subject to change and is not a guarantee of future results.
Chart 1, 1:13– Here we are looking at GDP, the broadest measurement of the economy. The columns are the quarterly change, and the bright blue line is the yearly change. All of the numbers are annualized for easy comparison.
Growth is the past quarter was an outstanding 4.3%. When excluding the pandemic rebound, it is the strongest pace of growth we've seen since 2019. It follows on the heels of a strong 3.8% in the second quarter. The strong growth has been driven by consumer spending and fixed investment, such as in data centers and computer equipment.
To put this pace of growth in perspective, the yellow horizontal line shows the rate of growth the Fed believes is ideal; it is strong enough to increase the demand for workers without raising inflation. These blue/gray columns show the market expectations for growth. Although fourth-quarter growth in 2025 will be relatively weak at 1.0%, due primarily to the extended federal government shutdown, the economy in 2026 is expected to grow at a pace slightly stronger than the Fed’s ideal pace.
We do not forecast quarterly GDP, but our expectation for 2026 is in the range of 1.75% to 2.25%, a tad stronger than market expectations.
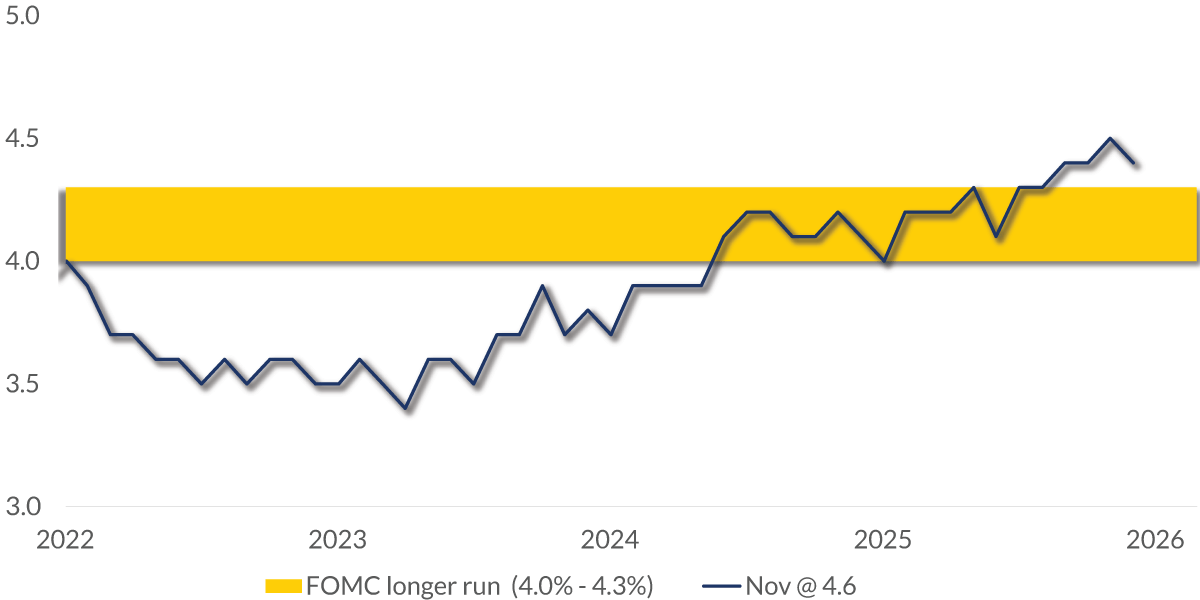
Unemployment Rate
%, seasonally adjusted
Data current as of January 20, 2026.
Source: Bureau of Labor Statistics
Information is subject to change and is not a guarantee of future results.
Chart 2, 2:36– Regarding labor, we are closely monitoring several indicators. Generally speaking, the labor market is very healthy. In this chart, you can see the unemployment rate is at just 4.4%, very close to the Fed’s ideal range of 4.0% to 4.3%.
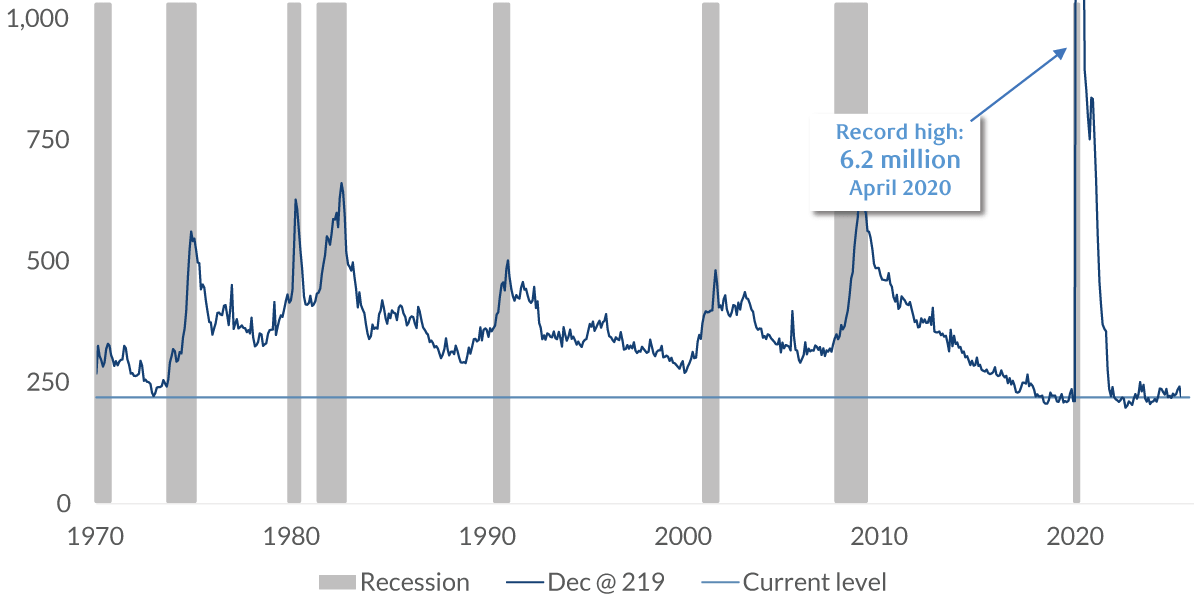
Initial Claims
'000, seasonally adjusted
Data current as of January 20, 2026.
Source: Department Labor
Information is subject to change and is not a guarantee of future results.
Chart 3, 2:54– Here is another metric for measuring labor demand. It measures initial unemployment insurance claims. Economists view this indicator as the “canary in the coal mine” since it is so timely. This data is released on Thursday mornings, based on the previous week’s count of people who become unemployed and are making their initial claim for unemployment insurance. This is a very long-term view, with data going back to 1970, showing that the number of people making this claim is hovering around the lows of the past 50-plus years. What makes this more impressive is that back in 1970, the labor force was less than half its current level, so, as a percentage of workers, the initial claims were extremely low.
Nonfarm Payrolls
'000, seasonally adjusted
Data current as of January 20, 2026.
Source: Bureau of Labor Statistics
Information is subject to change and is not a guarantee of future results.
Chart 4, 3:40– But this page shows the monthly payroll change. And this is a concern — it has cooled significantly since the spring.
For some perspective, the yellow line shows what economists believe is needed to keep the unemployment rate stable.
For the past three months, payroll growth has averaged a negative 22,000. For comparison, for the first three months of this year, before the tariffs started, it averaged 111,000 per month. Granted, the significant decline on the right side of the chart was due to federal workers taking early retirement, but private-sector payroll growth has been weak this year. This is especially true for smaller companies, which are considered to have been hurt the most by the tariffs. We are expecting that tariff news in 2026 will subside from 2025, and companies will be more comfortable in increasing their hiring plans.
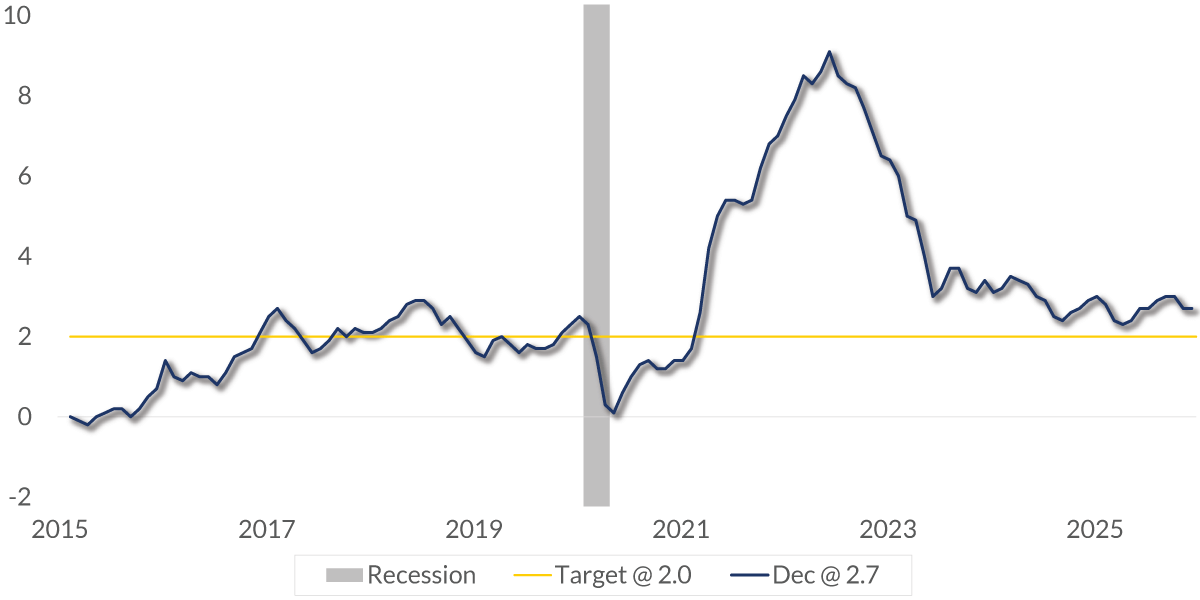
Consumer Price Index
%, y-o-y
Data current as of January 20, 2026.
Source: Bureau of Labor Statistics
Information is subject to change and is not a guarantee of future results.
Chart 5, 4:38– As for inflation, this chart shows the year-over-year change in the Consumer Price Index, currently at 2.7%, just above the Fed’s target. It is essential to keep in mind that the Fed does not expect the inflation rate to be at 2.0% right now. They believe it will happen by the end of 2027. With the downward trend bias, the Fed is not overly concerned about inflation, as it had been over the past few years.
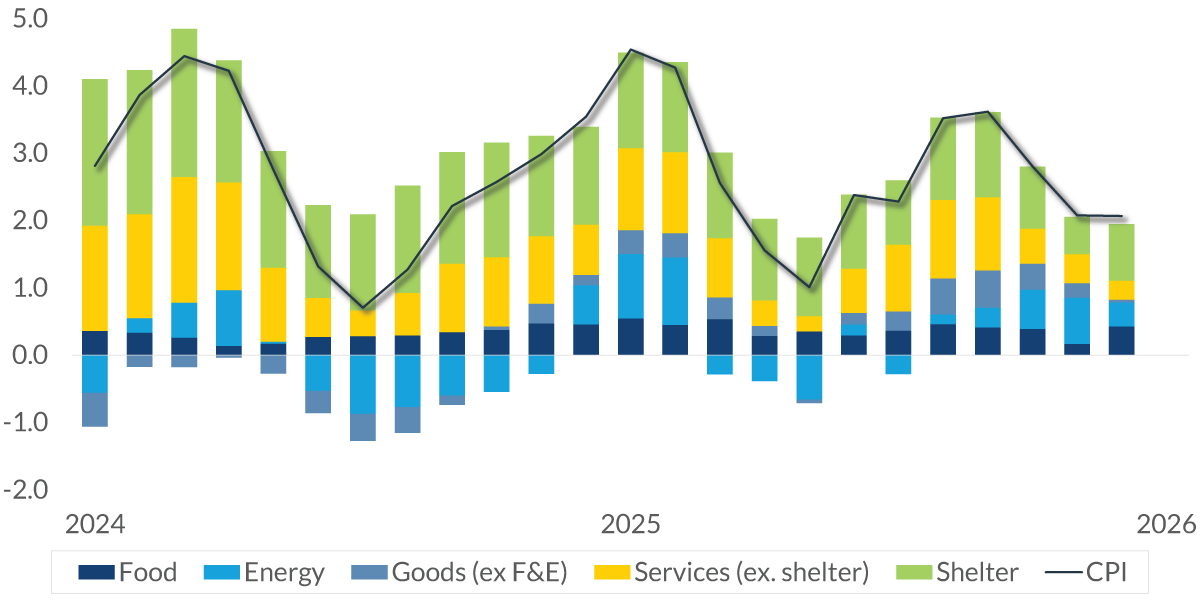
CPI: Contribution
3-mo. annualized rate, seasonally adjusted as of December 2025
Data current as of January 20, 2026.
Source: Bureau of Labor Statistics
Information is subject to change and is not a guarantee of future results.
Chart 6, 5:04– Supporting that belief is the fact that most major categories within CPI are showing a reduction in price pressures. This chart measures price changes over the past three months, making it easier to spot trend shifts. The numbers are annualized for easy comparison, most importantly for shelter (housing), which is in green. This component accounts for almost 40% of the index, so a slowing in price gains can help bring down the entire index.
Federal Funds & Neutral Fed Funds
%, notseasonally adjusted
Data current as of January 20, 2026.
Source: Federal Reserve
Information is subject to change and is not a guarantee of future results.
Chart 7, 5:35– So, what does this mean for the Fed? This chart here shows the recent history of the federal funds rate. On the right, you can see they have lowered the rate by 175 basis points since September 2024.
For perspective, this yellow line represents what the Fed believes is the neutral interest rate; that is, the rate that does not stimulate or restrict economic growth. The blue line is above the yellow line, indicating that the Fed has pursued restrictive monetary policy over the past few years. It was done to slow economic growth and allow inflation to decline. With inflation coming in line with the Fed’s goal, the Fed lowered rates to help stimulate labor growth.
The neutral rate is not observable; it is theoretical. Also, it is not written in stone.
So, economists and the Fed have a range of about 50 basis points above and below the neutral rate. You can see here that the funds rate is very close to that range. That is why the Fed believes they only need to cut interest rates by 25 basis points this year.
With the economy firing on all cylinders, the unemployment rate at a historically low level and inflation moderating, we believe the economy will grow slightly above trend, somewhere in the range of 1.75% to 2.25% this year. That does not mean there are no risks or concerns; there are. But most of them will not be severe enough to steer the economy off its rails. But if we do get that black swan, that unforeseen and consequential event, we will be back to give insight.
Important Information
The views expressed represent the opinions of RBC Rochdale, LLC which are subject to change and are not intended as a forecast or guarantee of future results. Stated information is provided for informational purposes only, and should not be perceived as personalized investment, financial, legal or tax advice or a recommendation for any security. It is derived from proprietary and non-proprietary sources which have not been independently verified for accuracy or completeness. While Rochdale believes the information to be accurate and reliable, we do not claim or have responsibility for its completeness, accuracy, or reliability. Statements of future expectations, estimates, projections, and other forward-looking statements are based on available information and management's view as of the time of these statements. Accordingly, such statements are inherently speculative as they are based-on assumptions which may involve known and unknown risks and uncertainties. Actual results, performance or events may differ materially from those expressed or implied in such statements.
All investment strategies have the potential for profit or loss; changes in investment strategies, contributions or withdrawals may materially alter the performance and results of a portfolio. Different types of investments involve varying degrees of risk, and there can be no assurance that any specific investment will be suitable or profitable for a client's investment portfolio.
© 2025 City National Bank. All rights reserved.
