
-
Economic Perspectives
“A billion here, a billion there, and pretty soon you’re talking real money.”
March 2024
- Filename
- Economic Perspectives MARCH 2024.pdf
- Format
- application/pdf

TRANSCRIPT
It's an election year, and news articles about the federal debt tend to be popular, so we thought a deep dive into this topic would be of value to you. One of my favorite quotes on this issue is the title of this month's video: “A billion here, a billion there, and pretty soon, you're talking real money.”
That quote is attributed to Everett Dirksen, the colorful Republican Senator from Illinois, who was cautioning that federal spending had a way of getting out of control. Well, that was back in the 1960’s – today, we could easily substitute trillions for billions.
Remember the debt ceiling conflict from last summer? Well, The Federal deficit has grown three trillion dollars higher. The words “millions,” “billions” and “trillions” all roll off the tongue rather easily, so I think maybe we should put some perspective on these numbers.
If you take a second, 1/60 of a minute, and multiply that by one million, the resulting amount of time is approximately twelve days. If you had a billion seconds, that's about 32 years – so the difference between a million and a billion is the difference between a newborn and a fully mature adult. As for a trillion seconds, it would amass to roughly 32,000 years.
Now, when we're looking at the debt, the first question we should ask is: What's the best way of measuring what the debt is? Let's look at some of the charts.
Federal Debt
%, December 31, 2023
Data current as of March 21, 2024
Sources: U.S. Treasury
Information is subject to change and is not a guarantee of future results.
Chart 1: 1:41– In this first chart, the total amount of debt that the federal government owes is 34 trillion dollars. However, about seven trillion, or 20%, is owned by some sectors of the government. This would be like the Social Security trust fund or the Highway trust fund. This leaves almost 27 trillion that is owned by the public. The total amount is called the gross amount. The net amount is what they call publicly held debt.
So, do you look at the total amount, or do you look at the net amount? Well, it depends on who you are. If you're Congress, and you're concerned about the debt ceiling, you look at the gross amount. If you're at the congressional budget office or most academics, you look at the amount that the public owns. They figure the asset in one part of the government offsets the liability in another part.
So, who owns the rest of this debt? This would be: the American public, foreigners, including other central banks, and the Fed, which is the single-largest owner of treasury debt. That's because of the sizable quantitative easing program they had during the pandemic to help bring us out of the recession.
Federal Debt
$, trillions
Data current as of March 21, 2024
Source: TreasuryDirect.gov
Information is subject to change and is not a guarantee of future results.
Chart 2: 2:49– In this chart, since 1900, you can see how much debt has snowballed in the past 40 years or so. I highlight this little bump in the early 1940’s (World War II) to put some perspective on this chart. In the fiscal year that ended September 1940, the total debt was 43 billion dollars. Just a few months later, Pearl Harbor was attacked, and by 1946, the peak of debt in that cycle, it was about 270 billion. That's 6.3 times larger than it was before the war started. Today, if we had that same magnitude of an increase, the 34 trillion-dollar debt would increase to 213 trillion.
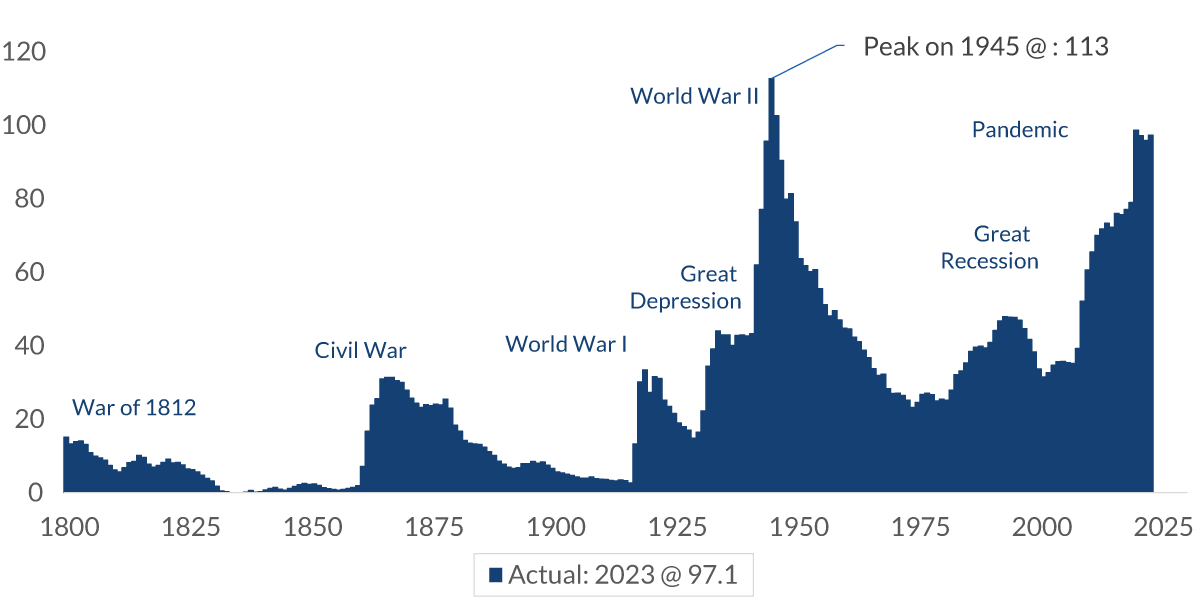
Federal Debt Held by the Public
percent of GDP
Data current as of March 21, 2024
Source: Congressional Budget Office
Information is subject to change and is not a guarantee of future results.
Chart 3: 3:33– However, comparing debt to past debt levels is not a fair way of doing it. Inflation has happened. The economy is so much bigger. So, the conventional way to measure this is by comparing the ratio of debt to economic output or GDP. It's a valuable way of evaluating a nation's ability to repay its debt. The lower the debt to GDP ratio, the more capable the country is of paying off its debt.
In this chart, Since the 1800’s, you can see that debt relative to GDP tends to grow during war or severe economic weakness. When those events are over, the debt is quickly paid down relative to the size of the economy. It wasn't until the 1980’s that debt more than doubled when there was no military or economic crisis. Some may argue that it helped cause the collapse of the Soviet Union, so it prevented a war, but ever since then, the federal government has been increasing spending on an annual basis, relative to the size of the economy.
Federal Surplus/Deficit as a Percent of GDP
%, annual
Data current as of March 21, 2024
Source: Congressional budget Office
Information is subject to change and is not a guarantee of future results.
Chart 4: 4:34– This chart measures the annual federal spending, relative to GDP, and to differentiate: Debt is measuring the aggregate amount that's owed, and the deficit is the annual amount that's owed.
This chart shows that, since 1960, there has only been a handful of times when there's been a surplus. The rest were deficits. This overlay shows that the trend is increasing in terms of the size of the annual deficit.
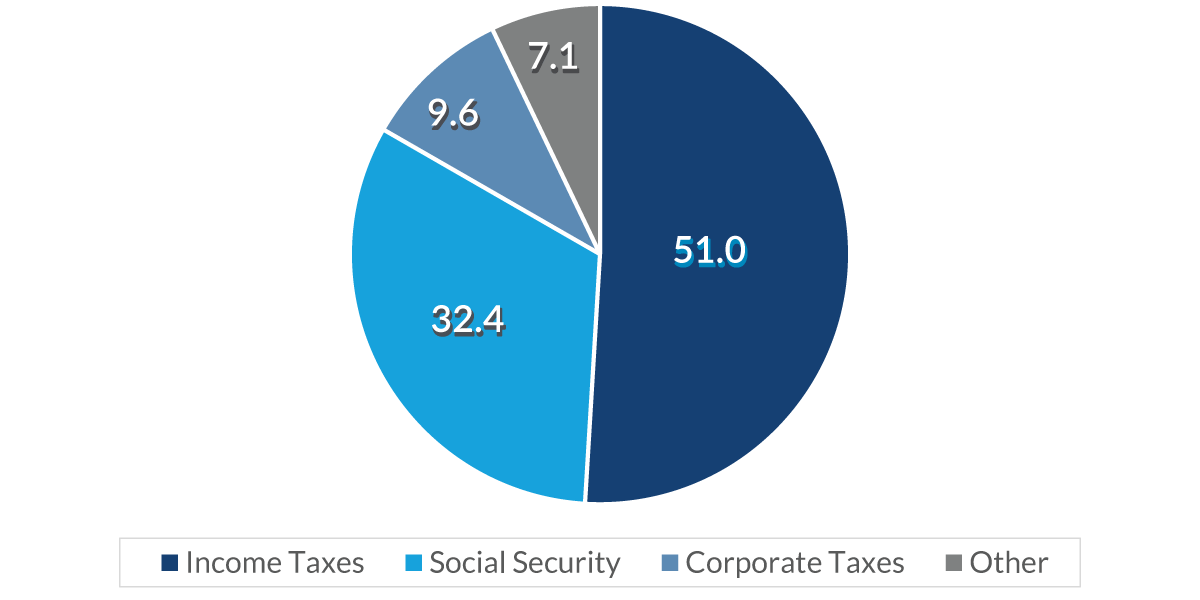
Federal Tax Revenues: Source
%, average of past two years, as of January 2024
Data current as of March 21, 2024
Source: Congressional Budget Office
Information is subject to change and is not a guarantee of future results.
Chart 5: 5:03– Now, there are two sides to the treasury's balance sheet: Revenue and liabilities. In this first chart, we're looking at the revenue. Think you pay a lot in taxes? Well, you're right, you do. Last year, the major categories of income brought in 4.6 trillion dollars: Income taxes accounted for 51%, social security was 32%, corporations paid just under 10%, and the category of “Other” at 7%, included things like excise, inheritance and custom taxes.
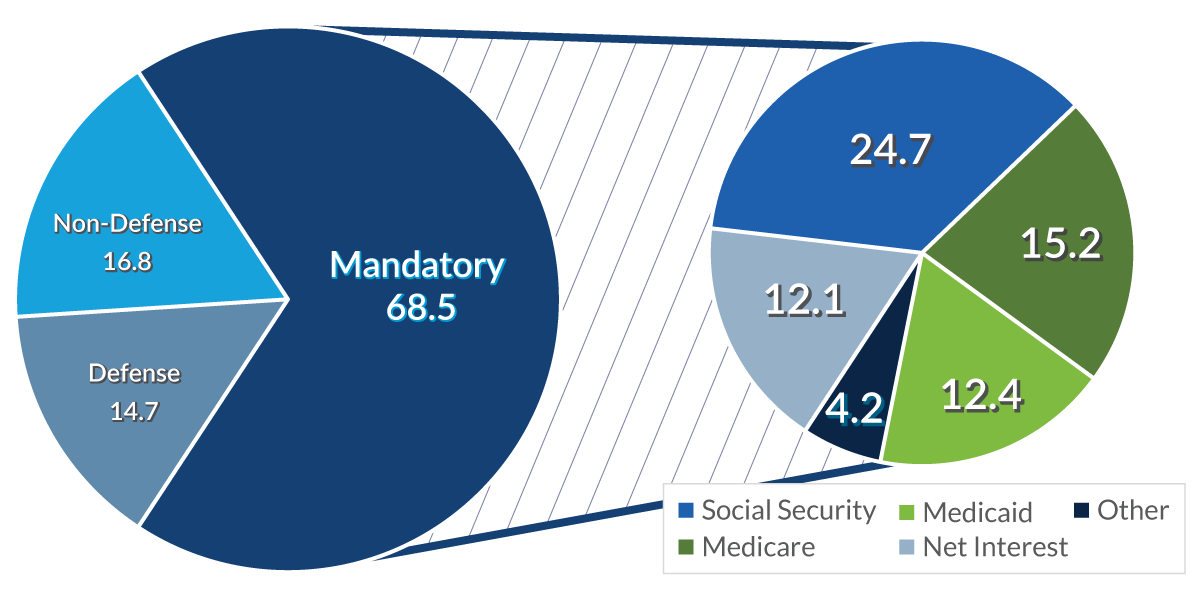
Federal Outlays
% of total
Data current as of March 21, 2024
Source: Congressional Budget Office
Information is subject to change and is not a guarantee of future results.
Chart 6: 5:36– As for outlays, the government recently spent 6.3 trillion dollars. Now there are two types of spending: Mandatory, which does not require an annual vote by Congress, covers about two-thirds of the spending. The remainder is Discretionary, which requires Congress to vote. Two significant categories also exist: Defense and Non-Defense. It's in these categories that Congress spends its time debating how to spend the money. As for the Mandatory spending, it applies to items such as Social Security, Medicare, Medicaid and, of course, net interest payments. It is expected to grow because of demographics and other trends contributing to increasing outlays. The population is aging, and healthcare costs are rising, and this, of course, puts pressure on Social Security and Medicare programs.
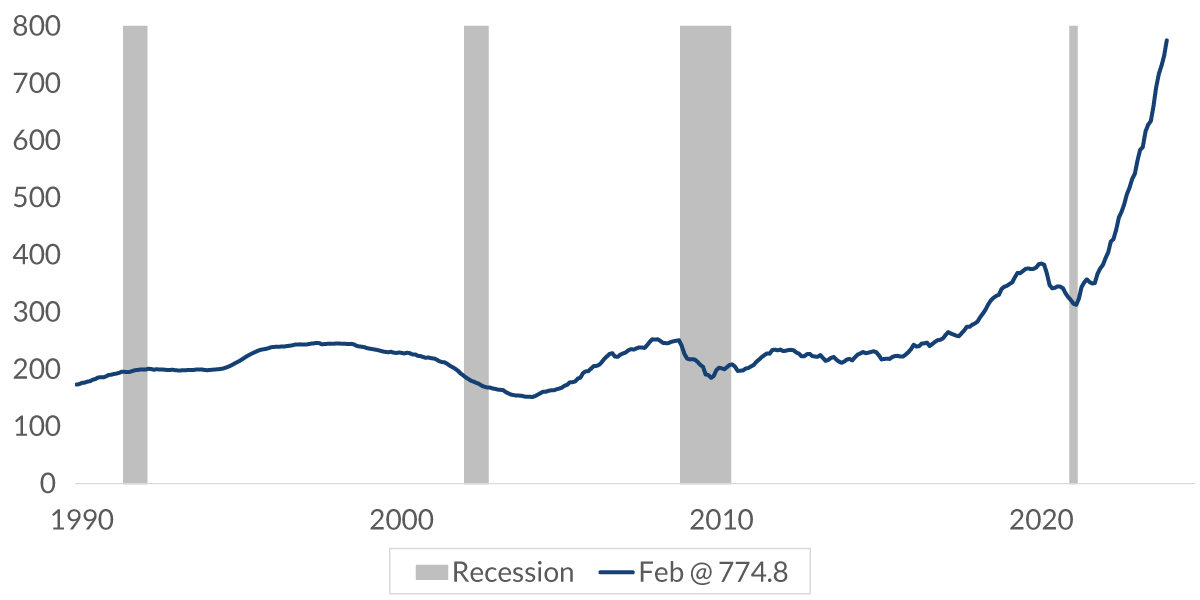
U.S. Treasury: Net Interest Payments
$, billions, 12-month rolling total
Data current as of March 21, 2024
Source: U.S. Treasury
Information is subject to change and is not a guarantee of future results.
Chart 7: 6:29– The net interest payment is something that tends to annoy the public. This chart shows how it has increased significantly in the past few years. Because of greater borrowing and higher interest rates, the CBO expects it to surpass the spending of defense this year. Now, the question that is asked most often is, “At what level of debt is it too much?” Well, that's sort of an elusive figure. Many factors influence that number. A larger economy can handle higher levels of debt to GDP than a smaller one can.
What type of economy is it? Is it a highly diversified economy, or not? Is it an emerging or developing economy? That makes a difference too. Is there a central bank that's independent from political pressures?
So, the level is not known, but like many things with credit, it's not a problem until it becomes a problem, and then it tends to be a big problem. We know that high levels of debt push up interest payments and slow economic growth by crowding out private investment and public spending that could otherwise be used to improve America's workforce infrastructure, and productive capacity.
So, how do we lower the debt? Well, the solution lies with Congress. It needs to develop a long-term fiscal plan that provides a cohesive picture. There are two key elements that need to happen. One is that economic growth has to be faster than debt growth, and the other is that Fiscal austerity needs to kick in where spending cuts or tax increases, or all, need to happen to help bring down the debt relative to the size of the growth of the economy.
Important Information
The views expressed represent the opinions of City National Rochdale, LLC (CNR) which are subject to change and are not intended as a forecast or guarantee of future results. Stated information is provided for informational purposes only, and should not be perceived as personalized investment, financial, legal or tax advice or a recommendation for any security. It is derived from proprietary and non-proprietary sources which have not been independently verified for accuracy or completeness. While CNR believes the information to be accurate and reliable, we do not claim or have responsibility for its completeness, accuracy, or reliability. Statements of future expectations, estimates, projections, and other forward-looking statements are based on available information and management's view as of the time of these statements. Accordingly, such statements are inherently speculative as they are based on assumptions which may involve known and unknown risks and uncertainties. Actual results, performance or events may differ materially from those expressed or implied in such statements. All investing is subject to risk, including the possible loss of the money you invest. As with any investment strategy, there is no guarantee that investment objectives will be met, and investors may lose money. Diversification does not ensure a profit or protect against a loss in a declining market. Past performance is no guarantee of future performance.
All investing is subject to risk, including the possible loss of the money you invest. As with any investment strategy, there is no guarantee that investment objectives will be met, and investors may lose money. Diversification does not ensure a profit or protect against a loss in a declining market. Past performance is no guarantee of future performance.
City National Rochdale, LLC, is a SEC-registered investment adviser and wholly owned subsidiary of City National Bank. Registration as an investment adviser does not imply any level of skill or expertise. City National Bank and City National Rochdale are subsidiaries of Royal Bank of Canada. City National Bank provides investment management services through its subadvisoryrelationship with City National Rochdale, LLC. City National Bank and City National Rochdale are subsidiaries of Royal Bank of Canada.
© 2024 City National Bank. All rights reserved.
CITY NATIONAL ROCHDALE, LLC NON-DEPOSIT INVESTMENT PRODUCTS ARE: • NOT FDIC INSURED •NOT BANK GUARANTEED •MAY LOSE VALUE


Put our insights to work for you.
If you have a client with more than $1 million in investable assets and want to find out about the benefits of our intelligently personalized portfolio management, speak with an investment consultant near you today.
If you’re a high-net-worth client who's interested in adding an experienced investment manager to your financial team, learn more about working with us here.
