Quarterly Update: Q2 2025
July 23, 2025


Key Points:
The second quarter of 2025 witnessed a remarkable recovery in U.S. equity markets following the tariff-induced volatility that defined the period’s opening. The S&P 500 surged nearly 11% during the quarter as stocks recovered from an early-April swoon sparked by concerns about tariffs. This dramatic rebound showcased the market’s resilience amid policy uncertainty and geopolitical tensions.
The quarter began with significant turbulence, as President Trump’s “Liberation Day” tariff announcement on April 2, 2025, triggered a global market sell-off and reignited recession fears. Markets initially plunged into correction territory, with the S&P 500 falling over 18% from February peaks (Feb. 19–April 8), before staging an impressive recovery through May and June. The S&P 500 and Nasdaq both closed the quarter at record highs, marking a stunning reversal from the April lows.
Technology sectors led the recovery with exceptional performance, demonstrating renewed investor confidence in growth and innovation themes. Information technology led the pack with just over a 23% quarterly gain, followed closely by communication services sectors, which benefited from strong earnings and investor enthusiasm. This represented a dramatic sector rotation from first-quarter 2025, when defensive sectors like energy and healthcare had outperformed, while technology stocks struggled under tariff uncertainty.
Geopolitical events provided additional market volatility, particularly the Israel-Iran conflict that erupted in June. The 12-day conflict, which included U.S. strikes on Iranian nuclear facilities, caused oil prices to rise from $70 to $81 per barrel, though the market impact proved more contained than historical precedents. Markets demonstrated resilience, as the conflict was contained by late June.
Corporate earnings remained robust throughout the period, with first-quarter 2025 results showing 12.7% earnings growth for the S&P 500, marking the second consecutive quarter of double-digit growth. The Magnificent 7 technology companies reported particularly strong first-quarter earnings growth of 31.8%, supporting the sector’s second-quarter recovery.
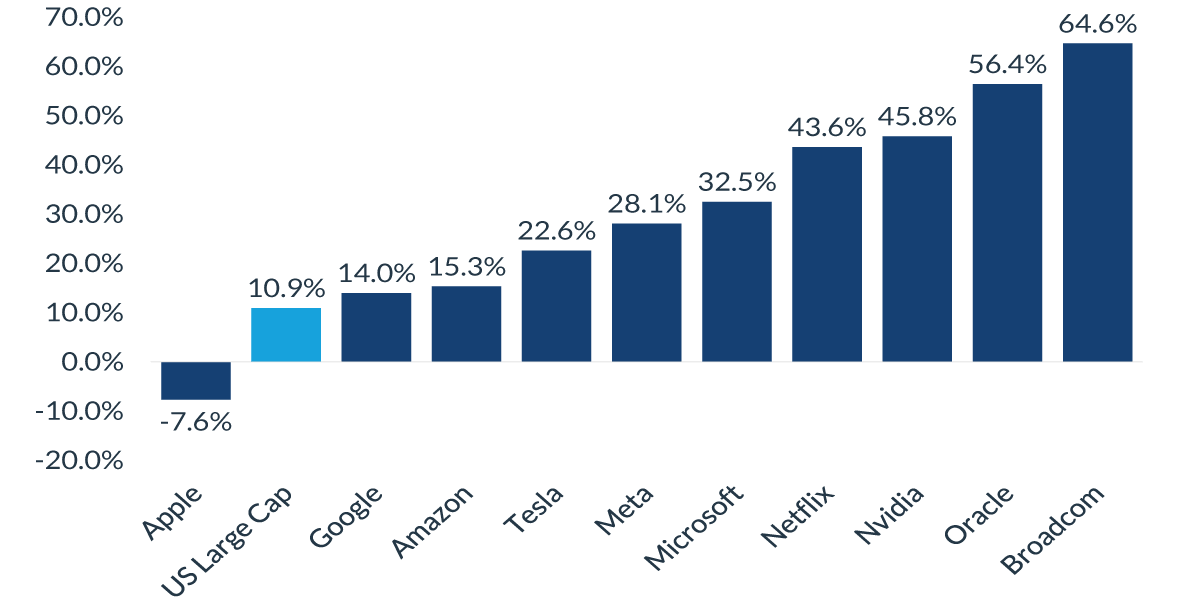
Source: Bloomberg, CNR Research as of June 30, 2025, starting March 31, 2025 Past performance is no guarantee of future results.
2025-Q2 Stock returns of selected technology and consumer discretionary companies
The Magnificent 7 Stocks include Alphabet, Amazon, Apple, Meta Platforms, Microsoft, Nvidia, and Tesla.
For the first half of 2025, U.S. equity markets delivered positive but modest returns, with the S&P 500 gaining 6.2%. The performance reflected a year of two distinct halves — early volatility followed by strong recovery, ultimately leaving major indexes near record levels despite significant policy and geopolitical headwinds.
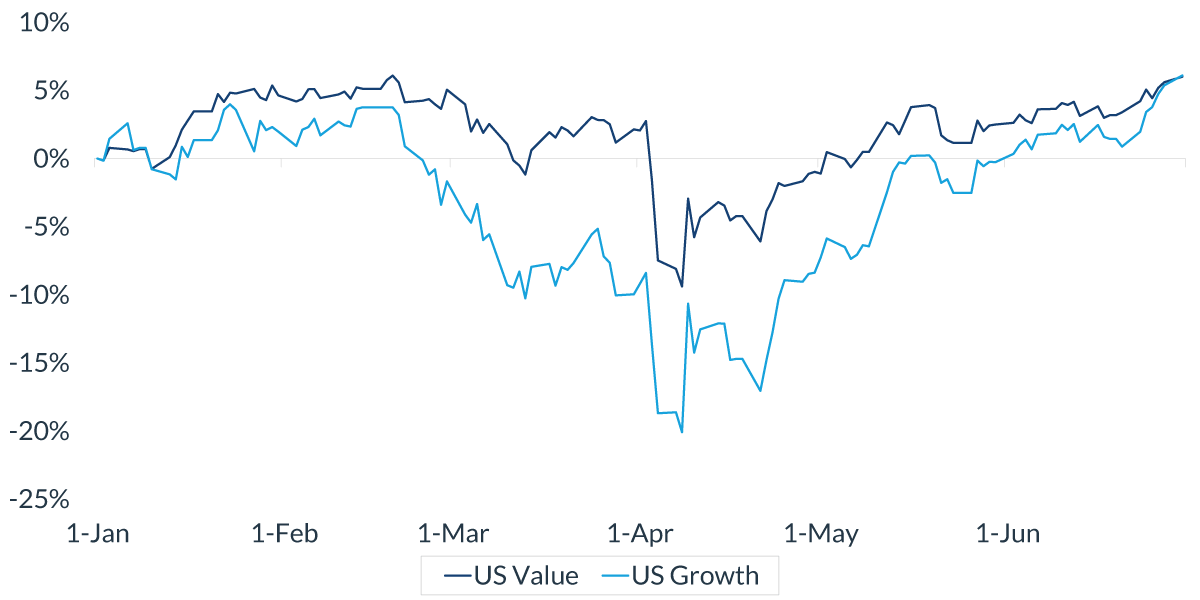
Source: Bloomberg, CNR Research as of June 30, 2025, starting December. 31, 2025, cumulative returns over time. Indices used: U.S. Value: Russell 1000 Value Index, U.S. Growth: Russell 1000 Growth Index.
Past performance is no guarantee of future results.
Indexes are unmanaged and do not reflect a deduction for fees or expenses. Investors cannot invest directly in an index. Information is subject to change and is not a guarantee of future results.
Important Information
The views expressed represent the opinions of City National Rochdale, LLC (CNR) which are subject to change and are not intended as a forecast or guarantee of future results. Stated information is provided for informational purposes only, and should not be perceived as personalized investment, financial, legal or tax advice or a recommendation for any security. It is derived from proprietary and non-proprietary sources which have not been independently verified for accuracy or completeness. While CNR believes the information to be accurate and reliable, we do not claim or have responsibility for its completeness, accuracy, or reliability. Statements of future expectations,estimates, projections, and other forward-looking statements are based on available information and management’s view as of the time of these statements. Accordingly, such statements are inherently speculative as they are based on assumptions which may involve known and unknown risks and uncertainties. Actual results, performance or events may differ materially from those expressed or implied in such statements.
All investing is subject to risk, including the possible loss of the money you invest. As with any investment strategy, there is no guarantee that investment objectives will be met, and investors may lose money. Diversification may not protect against market risk or loss. Past performance is no guarantee of future performance.
© 2025 City National Bank. All rights reserved.
Index Definitions
S&P 500 Index: The S&P 500 Index, or Standard & Poor’s 500 Index, is a market-capitalization-weighted index of 500 leading publicly traded companies in the US It is not an exact list of the top 500 US companies by market cap because there are other criteria that the index includes.
Bloomberg Municipal Bond Index: The Bloomberg US Municipal Bond Index measures the performance of investment grade, US dollar-denominated, long-term tax-exempt bonds.
Bloomberg Municipal High Yield Bond Index: The Bloomberg Municipal High Yield Bond Index measures the performance of non-investment grade, US dollar-denominated, and non-rated, tax-exempt bonds.
Bloomberg Investment Grade Index: The Bloomberg US Investment Grade Corporate Bond Index measures the performance of investment grade, corporate, fixed-rate bonds with maturities of one year or more.
The Dow Jones Industrial Average (DJIA) tracks thirty of America’s biggest and most established companies, acting like a quick temperature check of the U.S. economy.
The MSCI USA Large Cap Index is designed to measure the performance of the large cap segments of the US market. The index covers approximately 70% of the free float-adjusted market capitalization in the US.
The Bloomberg Investment Grade Corporate Bond Spreads refer to the spreads between investment grade, fixed-rate, taxable corporate bonds.
The Russell 1000 Value Index measures the performance of the large-cap value segment of the US equity universe. It includes Russell 1000 companies with lower price-to-book ratios, lower expected and historical growth rates.
The Russell 1000 Growth Index is a stock market index that measures the performance of the large-cap growth segment of the U.S. equity universe. It includes large and mid-cap companies that exhibit growth characteristics, and it is published and maintained by FTSE Russell.
The U.S. Treasury Index is an index that reflects recent auctions of actively traded U.S. government securities and is often used as a benchmark by lenders when establishing interest rates.
The Bloomberg U.S. Treasury: Intermediate Index measures US dollar-denominated, fixed-rate, nominal debt issued by the US Treasury.
The Bloomberg Municipal Short-Intermediate Bond Index is a measure of the US municipal tax-exempt investment grade bond market.
The Bloomberg US Corporate Bond Index measures the investment grade, fixed-rate, taxable corporate bond market. It includes USD-denominated securities publicly issued by US and non-US industrial, utility, and financial issuers.
The Bloomberg U.S. Intermediate Corporate Bond Index is a measure of the investment grade, fixed-rate, taxable corporate bond market.
The Bloomberg AA Municipal Bond Revenue Curve index is a measure of the US municipal tax-exempt investment grade bond market. It includes general obligation and revenue bonds, which can be pre-refunded years later and get reclassified as such.
The Bloomberg US Treasury Actives Curve is a curve that relates the yield on a security to its time to maturity.
The Bloomberg US Corporate AA Corporate Bond Revenue Curve represents the effective yield of the ICE BofA AA US Corporate Index, which tracks the performance of US dollar-denominated investment-grade rated corporate debt publicly issued in the US domestic market.
Bloomberg US Corporate High Yield To Worst refers to the yield to worst of the Bloomberg U.S. Corporate High Yield Bond Index.
The Bloomberg US Agg Corporate Yield To Worst is a measure of the lowest yield the Bloomberg US Aggregate Bond Index (Agg) has ever had while its effective duration is at its highest.
The Bloomberg US Agg Treasury Yield To Worst is an index that measures the yield of US Treasury bonds.
Definitions
The “core” Personal Consumption Expenditures (PCE) price index is defined as prices excluding food and energy prices. The core PCE price index measures the prices paid by consumers for goods and services without the volatility caused by movements in food and energy prices to reveal underlying inflation.
The Producer Price Index (PPI) is a measure of the average change over time in the selling prices received by domestic producers for their output.
A leveraged loan is a type of loan that is extended to companies or individuals that already have considerable amounts of debt or poor credit history.
Yield to worse (YTW) is the lowest potential yield that an issuer can pay on a bond without defaulting.
The option-adjusted spread (OAS) is the measurement of the spread of a fixed-income security rate and the risk-free rate of return, which is then adjusted to take into account an embedded option.
The Magnificent 7 refers to a group of major tech companies with stock growth that far outpaced the high-performing S&P 500 in recent years. Coined in 2023, the group consists of Alphabet, Amazon, Apple, Meta Platforms, Microsoft, Nvidia, and Tesla.
Nasdaq is a global electronic marketplace for buying and selling securities. Its name was originally an acronym for the National Association of Securities Dealers Automated Quotations.
© 2025 City National Bank. All rights reserved.
Non-deposit investment Products are: • not FDIC insured • not Bank guaranteed • may lose value
If you have a client with more than $1 million in investable assets and want to find out about the benefits of our intelligently personalized portfolio management, speak with an investment consultant near you today.
If you’re a high-net-worth client who's interested in adding an experienced investment manager to your financial team, learn more about working with us here.
.png)