Quarterly Update: Q2 2025
July 23, 2025


Key Points:
Investment-grade (IG) fixed-income returns were mixed to end the first quarter. While all pockets of the financial market confronted elevated volatility, uneven performance developed toward the final weeks of the first quarter.
The U.S. Treasury Index outpaced other IG asset classes, rewarding investors with a 2.92% total return versus a loss of 22 basis points (bps) for IG municipal bonds and 2.31% for IG corporate bonds, per Bloomberg indexes. Front and center was the uncertainty over U.S. trade policy, particularly the impact of tariffs, as well as escalating geopolitical and economic risks. These events pushed inflation expectations up and growth down and pulled consumption forward as businesses and consumers dashed to get ahead of implementation. The results were lower rates and wider credit spreads. The bellwether 10-year U.S. Treasury bond declined a cumulative 37 bps during the first quarter, reflecting more periods of risk-off investor sentiment. While the Federal Reserve left its overnight lending rate unchanged at its March meeting, it faces potentially difficult policy choices ahead with a tug-of-war between mitigating rising prices and staving off disruptions to employment. That being said, easing rates may not cure imbalances, but time perhaps will.
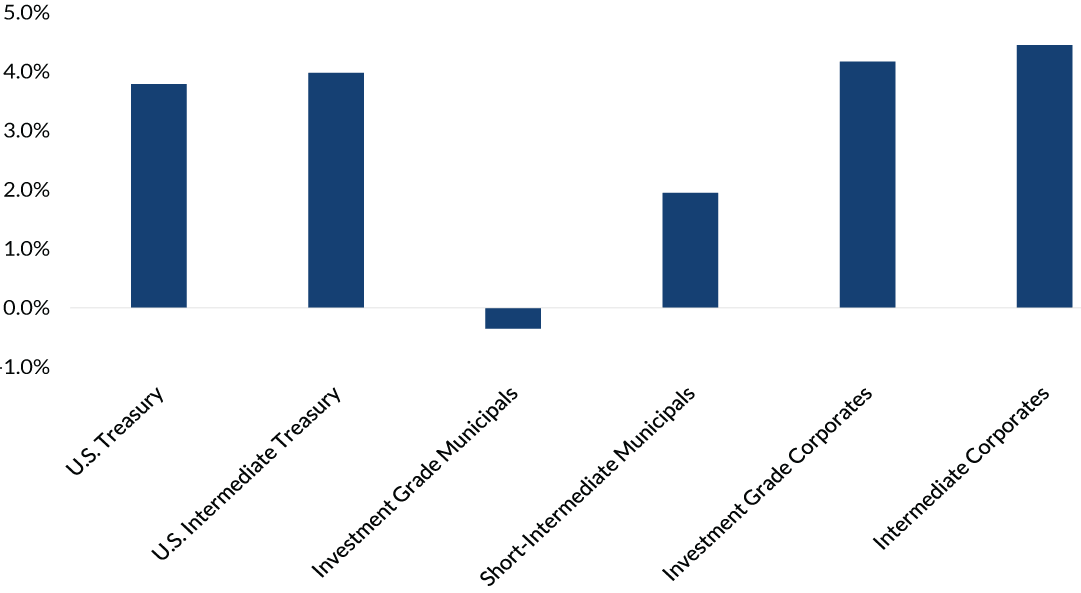
Source: Bloomberg, as of June 30, 2025. Past performance is no guarantee of future results.
Indices used: US Treasury Index, US Intermediate Treasury Index, Municipal Bond Index, Municipal Short-Intermediate Bond Index, US Corporate Bond Index, US Intermediate Corporate Bond Index.
A key observation during the first quarter was the change in valuations and risk pricing across IG bonds. Credit spreads on the Bloomberg U.S. Corporate Investment Grade Index widened between +14 bps and +94 bps, hitting its highest level since August 2024. While close monitoring of corporate fundamentals is warranted as economic headwinds swirl, IG corporate borrowers should continue benefiting from mostly healthy balance sheets, stable leverage and favorable cash flow generation. The magnitude and duration of policy shifts associated with trade and economic factors could further weigh on credit spreads and pricing. In municipals, the ratio of the 10-year AAA benchmark municipal bond versus a comparable Treasury bond is a key valuation metric. This metric increased meaningfully in the final weeks of the first quarter, as Treasury rates held steady and municipal yields rose (i.e., municipals underperformed), making municipal bonds more attractive at levels not seen in at least two years. Valuations coupled with mostly durable credit conditions, albeit normalizing for issuers given policy shifts, offer compelling value for market investors and could continue as volatility increases in the near term.
One theme that fixed-income investors have continually embraced is income. At quarter-end, the yield to worst of IG municipal bonds and IG corporate bonds, per Bloomberg, was 3.85% and 5.15%, respectively. Attractive yields provide good cash flow and may act as a buffer to rate volatility. Moreover, higher yields benefit forward-return potential. As we progress through the next few months, staying engaged in the markets when dislocation surfaces can add value to long-term investors, but adhering to sound active management and security selection will be crucial to navigating economic uncertainty.
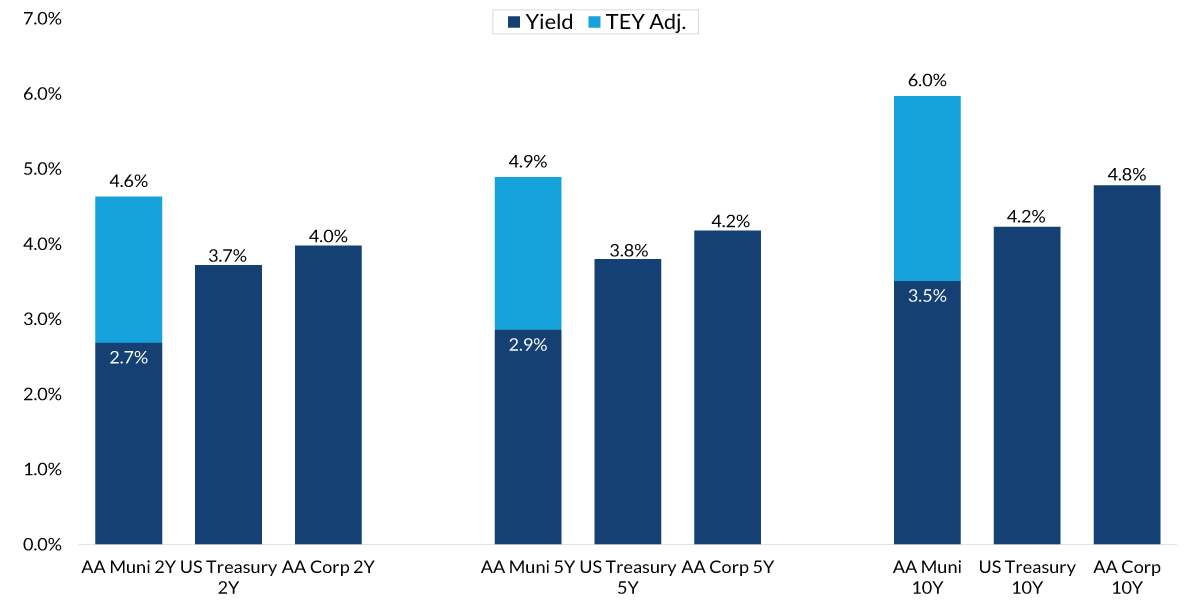
Source: Bloomberg, as of June 30, 2025. Past performance is no guarantee of future results.
Indicies used: AA Municipal Bond Revenue Curve, US Actives Treasury Curve, US AA Corporate Bond Revenue Curve.
Important Information
The views expressed represent the opinions of City National Rochdale, LLC (CNR) which are subject to change and are not intended as a forecast or guarantee of future results. Stated information is provided for informational purposes only, and should not be perceived as personalized investment, financial, legal or tax advice or a recommendation for any security. It is derived from proprietary and non-proprietary sources which have not been independently verified for accuracy or completeness. While CNR believes the information to be accurate and reliable, we do not claim or have responsibility for its completeness, accuracy, or reliability. Statements of future expectations,estimates, projections, and other forward-looking statements are based on available information and management’s view as of the time of these statements. Accordingly, such statements are inherently speculative as they are based on assumptions which may involve known and unknown risks and uncertainties. Actual results, performance or events may differ materially from those expressed or implied in such statements.
All investing is subject to risk, including the possible loss of the money you invest. As with any investment strategy, there is no guarantee that investment objectives will be met, and investors may lose money. Diversification may not protect against market risk or loss. Past performance is no guarantee of future performance.
© 2025 City National Bank. All rights reserved.
Index Definitions
S&P 500 Index: The S&P 500 Index, or Standard & Poor’s 500 Index, is a market-capitalization-weighted index of 500 leading publicly traded companies in the US It is not an exact list of the top 500 US companies by market cap because there are other criteria that the index includes.
Bloomberg Municipal Bond Index: The Bloomberg US Municipal Bond Index measures the performance of investment grade, US dollar-denominated, long-term tax-exempt bonds.
Bloomberg Municipal High Yield Bond Index: The Bloomberg Municipal High Yield Bond Index measures the performance of non-investment grade, US dollar-denominated, and non-rated, tax-exempt bonds.
Bloomberg Investment Grade Index: The Bloomberg US Investment Grade Corporate Bond Index measures the performance of investment grade, corporate, fixed-rate bonds with maturities of one year or more.
The Dow Jones Industrial Average (DJIA) tracks thirty of America’s biggest and most established companies, acting like a quick temperature check of the U.S. economy.
The MSCI USA Large Cap Index is designed to measure the performance of the large cap segments of the US market. The index covers approximately 70% of the free float-adjusted market capitalization in the US.
The Bloomberg Investment Grade Corporate Bond Spreads refer to the spreads between investment grade, fixed-rate, taxable corporate bonds.
The Russell 1000 Value Index measures the performance of the large-cap value segment of the US equity universe. It includes Russell 1000 companies with lower price-to-book ratios, lower expected and historical growth rates.
The Russell 1000 Growth Index is a stock market index that measures the performance of the large-cap growth segment of the U.S. equity universe. It includes large and mid-cap companies that exhibit growth characteristics, and it is published and maintained by FTSE Russell.
The U.S. Treasury Index is an index that reflects recent auctions of actively traded U.S. government securities and is often used as a benchmark by lenders when establishing interest rates.
The Bloomberg U.S. Treasury: Intermediate Index measures US dollar-denominated, fixed-rate, nominal debt issued by the US Treasury.
The Bloomberg Municipal Short-Intermediate Bond Index is a measure of the US municipal tax-exempt investment grade bond market.
The Bloomberg US Corporate Bond Index measures the investment grade, fixed-rate, taxable corporate bond market. It includes USD-denominated securities publicly issued by US and non-US industrial, utility, and financial issuers.
The Bloomberg U.S. Intermediate Corporate Bond Index is a measure of the investment grade, fixed-rate, taxable corporate bond market.
The Bloomberg AA Municipal Bond Revenue Curve index is a measure of the US municipal tax-exempt investment grade bond market. It includes general obligation and revenue bonds, which can be pre-refunded years later and get reclassified as such.
The Bloomberg US Treasury Actives Curve is a curve that relates the yield on a security to its time to maturity.
The Bloomberg US Corporate AA Corporate Bond Revenue Curve represents the effective yield of the ICE BofA AA US Corporate Index, which tracks the performance of US dollar-denominated investment-grade rated corporate debt publicly issued in the US domestic market.
Bloomberg US Corporate High Yield To Worst refers to the yield to worst of the Bloomberg U.S. Corporate High Yield Bond Index.
The Bloomberg US Agg Corporate Yield To Worst is a measure of the lowest yield the Bloomberg US Aggregate Bond Index (Agg) has ever had while its effective duration is at its highest.
The Bloomberg US Agg Treasury Yield To Worst is an index that measures the yield of US Treasury bonds.
Definitions
The “core” Personal Consumption Expenditures (PCE) price index is defined as prices excluding food and energy prices. The core PCE price index measures the prices paid by consumers for goods and services without the volatility caused by movements in food and energy prices to reveal underlying inflation.
The Producer Price Index (PPI) is a measure of the average change over time in the selling prices received by domestic producers for their output.
A leveraged loan is a type of loan that is extended to companies or individuals that already have considerable amounts of debt or poor credit history.
Yield to worse (YTW) is the lowest potential yield that an issuer can pay on a bond without defaulting.
The option-adjusted spread (OAS) is the measurement of the spread of a fixed-income security rate and the risk-free rate of return, which is then adjusted to take into account an embedded option.
The Magnificent 7 refers to a group of major tech companies with stock growth that far outpaced the high-performing S&P 500 in recent years. Coined in 2023, the group consists of Alphabet, Amazon, Apple, Meta Platforms, Microsoft, Nvidia, and Tesla.
Nasdaq is a global electronic marketplace for buying and selling securities. Its name was originally an acronym for the National Association of Securities Dealers Automated Quotations.
© 2025 City National Bank. All rights reserved.
Non-deposit investment Products are: • not FDIC insured • not Bank guaranteed • may lose value
If you have a client with more than $1 million in investable assets and want to find out about the benefits of our intelligently personalized portfolio management, speak with an investment consultant near you today.
If you’re a high-net-worth client who's interested in adding an experienced investment manager to your financial team, learn more about working with us here.