
-
Economic Perspectives
Housing: The Fundamentals Behind the Struggling Housing Sector
July 2025
- Filename
- Economic Perspectives July 2025.pdf
- Format
- application/pdf

TRANSCRIPT
The housing sector is an important and complex segment of the economy. For homeowners, they enjoy price appreciation. But for those looking to purchase a home, they don't want to see substantial price increases. That's what reduces the affordability.
Additionally, there's an economic impact of home construction. Whether it's a new construction or remodeling, it has the ability to create demand for construction workers. And there's about 1 million people working in residential construction right now. This month, we'll examine some of the factors that are affecting the housing market this year. Let's take a look at some charts.
New & Existing Home Sales
units, millions, seasonally adjusted annual rate
Data current as of July 20, 2025
Source: U.S. Census Bureau, National Association of Realtors
Information is subject to change and is not a guarantee of future results.
Chart 1, 0:56– To set the stage and provide some long-term perspective, we start with home sales. In this chart, which combines new and existing homes, it begins in 2000. You can see the surge from 2002 to 2005, when obtaining a mortgage was relatively easy. However, that ultimately contributed to the housing crisis, and housing sales were cut in half from about an annual rate of 8 million units to about 4 million. The housing crisis helped lead to the 2008 financial crisis. But following that recession, there was a gradual return to increase sales over the next 10 years as the economic expansion continued.
In 2020, the pandemic occurred and the Fed lowered interest rates, causing mortgage rates to fall below 3% for a 30-year fixed rate mortgage. Well, demand jumped to almost 7 million annual sales. Sales remained strong for about two years as working from home became more acceptable. Many new homebuyers migrated to more affordable cities to buy their first home.
In addition, others purchased a second home as an investment or for the enjoyment of having a second residence, usually in a warmer climate. However, in 2022, the Fed began to raise short-term interest rates to combat inflation, and mortgage rates spiked, reaching as high as 8% in 2023. That, of course, dried up demand. Although mortgage rates have retreated somewhat and have averaged around 6.75% in the past year, you can see that sales have remained in the doldrums at a level that's not been seen since we came out of the global financial crisis.
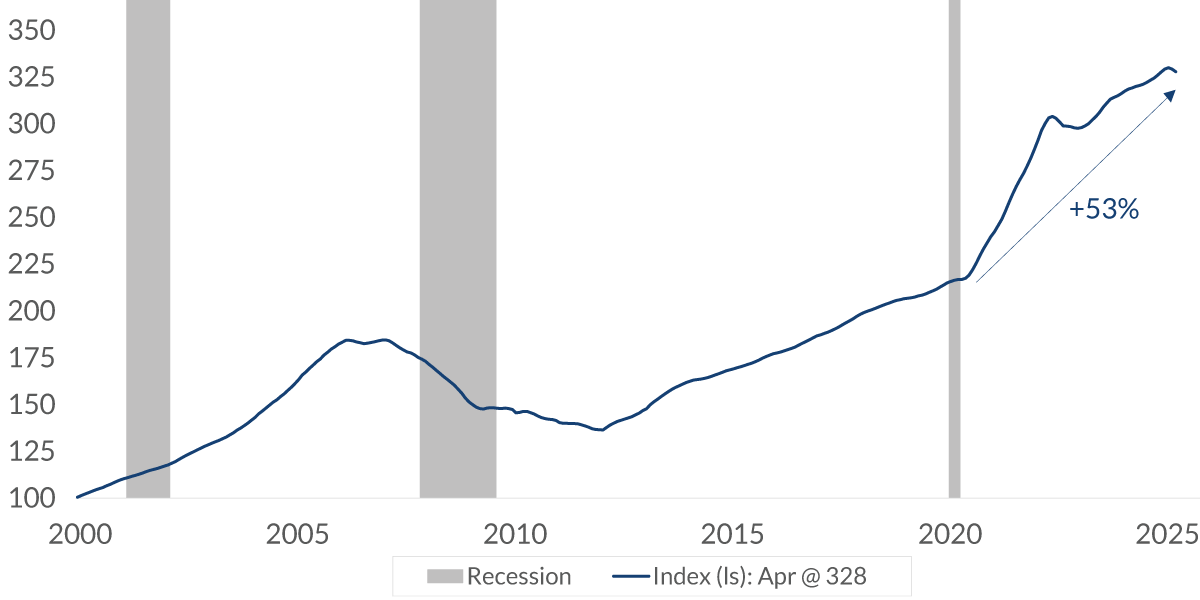
Home Price Index: U.S. National
index value, seasonally adjusted
Data current as of July 20, 2025
Source: S&P CoreLogic Case-Shiller
Information is subject to change and is not a guarantee of future results.
Chart 2, 2:36– It is not just mortgage rates that have reduced demand. The price of a home is another reason. In this chart, you can see the index of national home prices, which have increased more than 50% since the pandemic. For those who own a home, it's been a nice return on their investment — especially if they have a mortgage, since it makes it a leveraged purchase, making the return on investment higher. But for those looking to buy a home, it makes it less affordable.
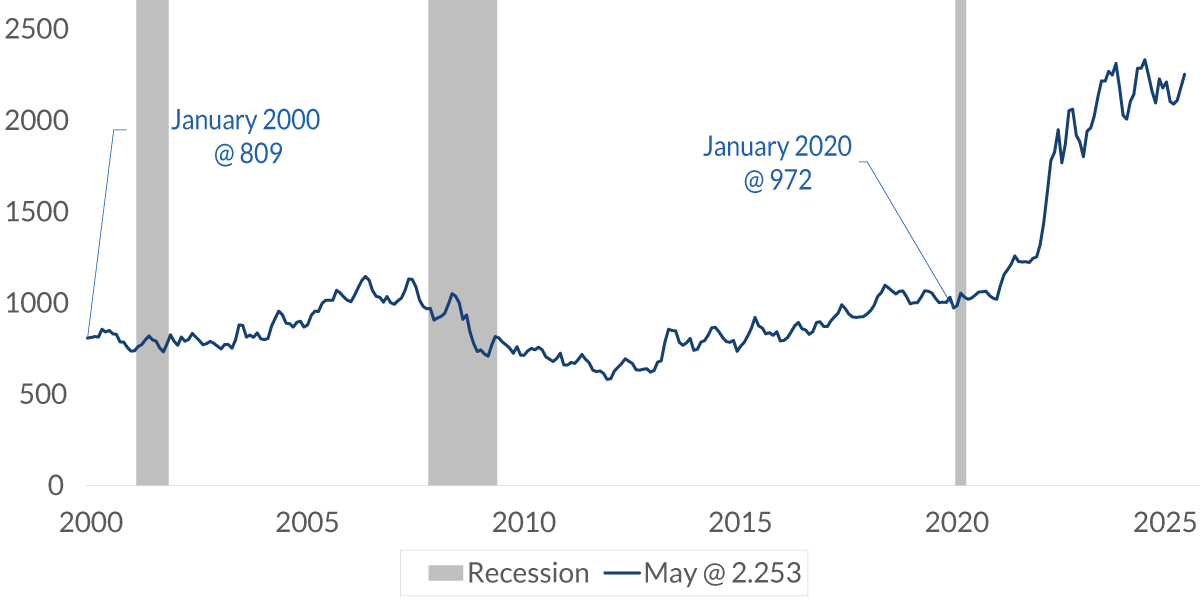
Monthly Mortgage Payment - Median Price of Existing Home
$, 30-year fixed rate mortgage, 80% financing
Data current as of July 20, 2025
Source: National Association of Realtors, Bankrate.com, CNR Research
Information is subject to change and is not a guarantee of future results.
Chart 3, 3:02– This chart shows the amount of a monthly mortgage payment of a median-priced home. You can see on the very far right that it costs $2,253 for that mortgage payment, which is about twice the amount compared to what it was before the pandemic. This is due to the price appreciation of the home and higher mortgage rates. Most of that increase is attributed to the higher interest payments.
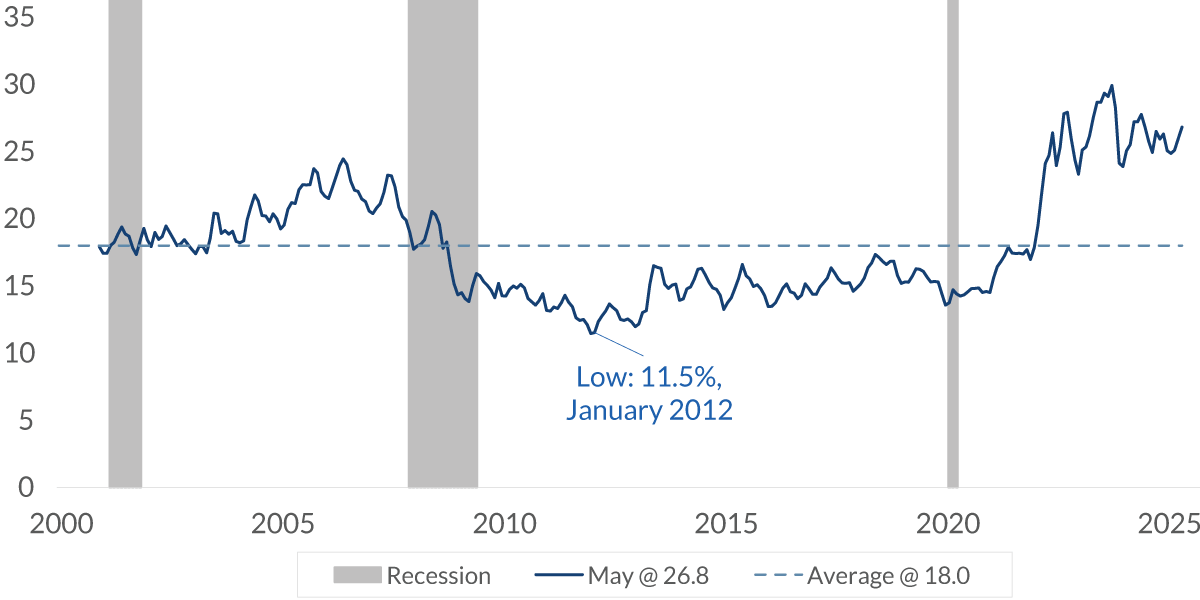
Mortgage Payment as a Percent of Median Family Income
%, based on an 80% loan to value mortgage
Data current as of July 20, 2025
Source: National Association of Realtors, Bankrate.com, CNR Research
Information is subject to change and is not a guarantee of future results.
Chart 4, 3:26– Although income has increased since the pandemic, it's not increased enough to offset the higher cost. This chart illustrates the mortgage payment as a percent of median family income. The move has been substantial. It's now about 27%, well above the prerecession average of around 15%.
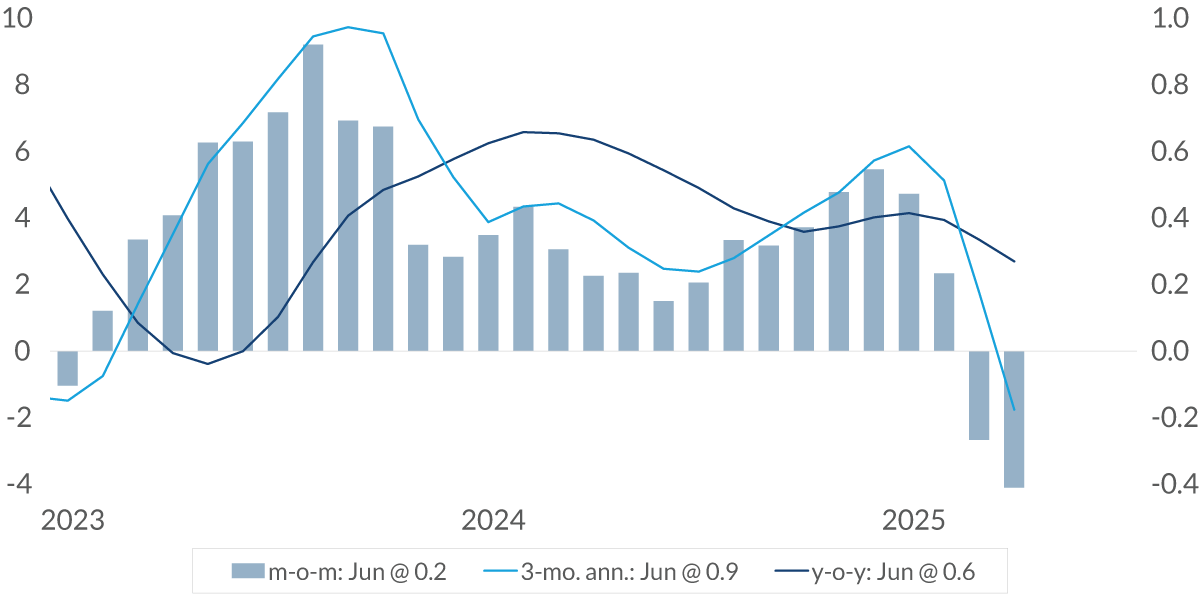
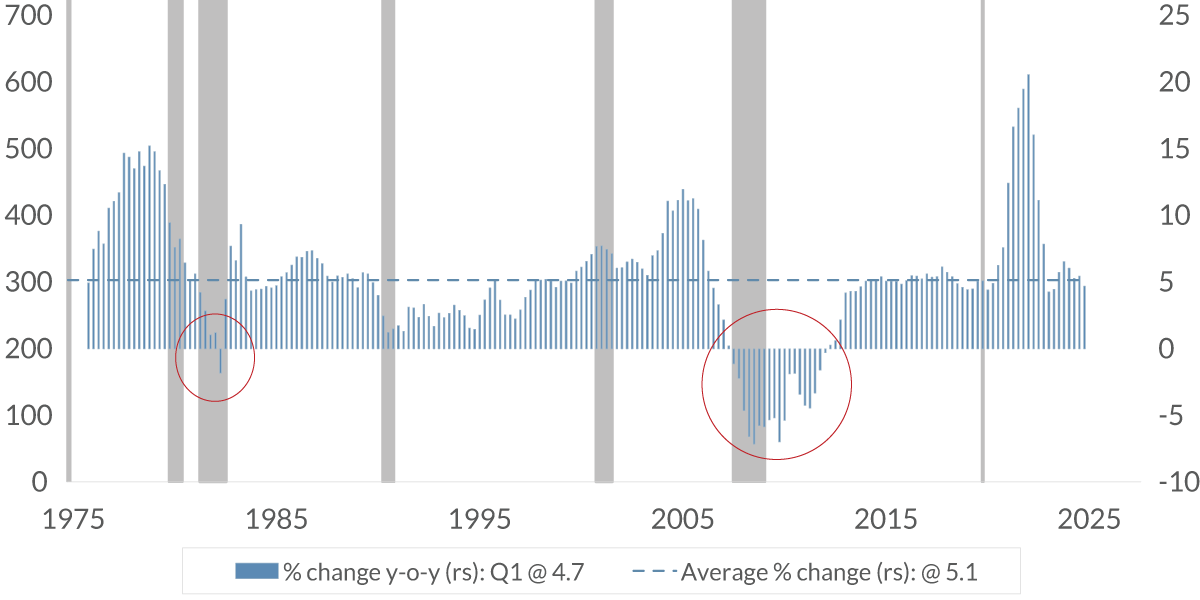
Home Price Index: U.S. National Index
% change, seasonally adjusted
Data current as of July 20, 2025
Source: S&P CoreLogic Case-Shiller
Information is subject to change and is not a guarantee of future results.
Chart 5, 3:46– One thing the housing market hasn't seen in a while is a decline in prices. The columns in this chart show the monthly change, which has declined in the past two months.
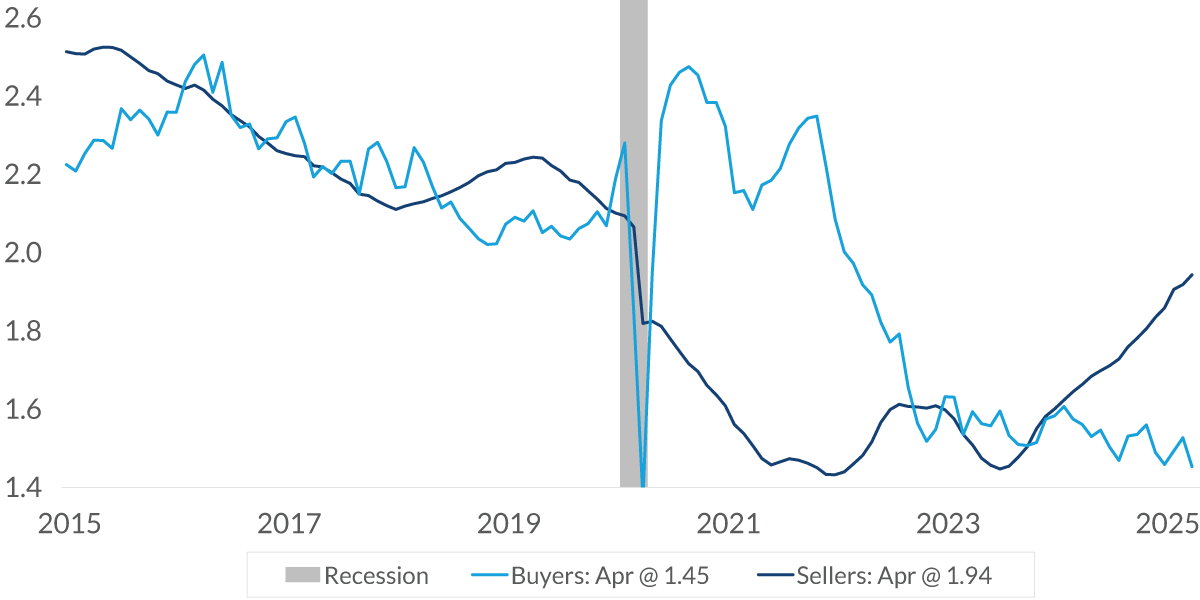
Estimated Number of Homebuyers and Sellers
millions
Data current as of July 20, 2025
Source: MLS data (Multiple Listing Service), Redfin data
Information is subject to change and is not a guarantee of future results.
Chart 6, 3:56– Why the decline? Part of it is simple economic issue of supply and demand in the market.
In this chart, the dark blue line represents the estimated number of homes for sale, which has increased significantly over the past two years or so. This overhang has exerted downward pressure on some home prices. Cities with a decline in value tend to be those that are very expensive homes, or cities where people have purchased a second home and they're now selling it, enjoying the capital gain. Monthly declines are not uncommon.
That said, it usually occurs when the Fed is hiking interest rates or the economy is entering a recession. Also, this is just one measurement. Existing home sales for June, which were just released this morning and they comprise about 80% of total sales, just hit a record high.
Home Prices
% change in the past two months, seasonally adjusted as of April 2025
Data current as of July 20, 2025
Source: S&P CoreLogic Case-Shiller
Information is subject to change and is not a guarantee of future results.
Chart 7, 4:48– But year-over-year declines are very rare.
In this chart, which dates back to the mid-1970s, there have only been two times when the yearly change in national home prices [was] in the negative territory. Most recently, there was the global financial crisis, which is a story in itself due to the severity and breadth of that economic downturn. The only other time was one quarter back in 1982, shortly after mortgage rates had moved to 18%.
Now, various cities may experience a yearly decline, but nationwide they rarely decline. Over time, the value of a home tends to appreciate, making it a good investment in addition to providing a place to live.
It's important to remember that home sales are very cyclical. Changes in interest rates or economic conditions, along with the economic outlook, will influence the level of sales.
Yes, right now there is excess supply of homes for sale, but the economic fundamentals for increasing demand appear to be turning favorable. The unemployment rate is very low and the financial condition of homebuyers is considered to be quite strong due to the robust economy and rallying financial markets of the past years. Most important, the economic uncertainty of the public is expected to decline as the federal budget for next year has been recently decided and trade agreements are in the process of being agreed upon. Also, we expect the Fed to restart its easing of monetary policy later this year by cutting interest rates. With that, we expect demand for homes to increase, albeit slowly.
Important Information
The information presented does not involve the rendering of personalized investment, financial, legal, or tax advice. This presentation is not an offer to buy or sell, or a solicitation of any offer to buy or sell any of the securities mentioned herein.
Certain statements contained herein may constitute projections, forecasts and other forward-looking statements, which do not reflect actual results and are based primarily upon a hypothetical set of assumptions applied to certain historical financial information. Viewers are cautioned that such forward-looking statements are not a guarantee of future results, involve risks and uncertainties, and actual results may differ materially from those statements. Certain information has been provided by third-party sources and, although believed to be reliable, it has not been independently verified and its accuracy or completeness cannot be guaranteed.
Any opinions, projections, forecasts, and forward-looking statements presented herein are valid as of the date of this video’s distribution and are subject to change.
Past performance or performance based upon assumptions is no guarantee of future results.
All investing is subject to risk, including the possible loss of the money you invest. As with any investment strategy, there is no guarantee that investment objectives will be met and investors may lose money. Diversification does not ensure a profit or protect against a loss in a declining market.
City National Rochdale, LLC is an SEC-registered investment adviser and wholly-owned subsidiary of City National Bank. Registration as an investment adviser does not imply any level of skill or expertise. City National Bank is a subsidiary of the Royal Bank of Canada.
© 2025 City National Bank. All rights reserved.
NON-DEPOSIT INVESTMENT PRODUCTS ARE: • NOT FDIC INSURED • NOT BANK GUARANTEED • MAY LOSE VALUE
Put our insights to work for you.
If you have a client with more than $1 million in investable assets and want to find out about the benefits of our intelligently personalized portfolio management, speak with an investment consultant near you today.
If you’re a high-net-worth client who's interested in adding an experienced investment manager to your financial team, learn more about working with us here.
