
Rochdale SpeedometersSM
December 2025
Forward-Looking Six to Nine Months

TRANSCRIPT
As we reach the end of 2025, the economic environment presents a mix of familiar challenges and emerging opportunities. Inflation is still uneven across categories, the labor market is cooling and policy uncertainty remains high. Yet, the economy continues to move forward, corporate earnings delivered outstanding results this fall and several global markets are entering 2026 with more appealing fundamentals than they’ve had in years. Rather than being defined solely by extremes, such as high valuations in the U.S. market, the landscape is responding to the rollout of artificial intelligence beyond technology companies and the expanding opportunity set across global markets, driven primarily by a renaissance in defense and infrastructure development.
Inflation continues to evolve in ways that require attention. Services inflation has been gradually easing, but goods inflation has picked up noticeably, driven in part by tariff-related pressures. The government shutdown limited access to some of the usual data we rely on for additional clarity, but the broad takeaway is clear: inflation progress has not been uniform and goods prices are still worrisome.
Even so, growth has surprised to the upside. Consumers continue to spend, supported by rising real incomes and the gradual easing of financing conditions. Business investment has held up as well, helped by strong profitability, increased automation and broader adoption of AI-driven tools. We could be in a “sweet spot,” as U.S. growth continues to expand at a pace that supports income growth, manageable price pressures and a more predictable backdrop for companies.
All of this sets the stage for monetary policy, where the Federal Reserve owns the spotlight. A December rate cut is widely expected, but the path forward is more complicated than that headline suggests. The Fed is facing a growing challenge in preserving its independence as political pressures intensify and internal divisions become more visible.
There has been a noticeable pickup in dissents at recent meetings, reflecting real disagreement among policymakers about how quickly to ease and how much risk the Fed should accept in the labor market. Some members are uncomfortable with the idea of cutting rates while goods inflation is rising, unemployment has only recently moved above 4.4%, and parts of the data picture remain incomplete following the shutdown. These divisions signal a committee that is less unified than it was earlier in the tightening cycle.
At the same time, the likely appointment of Kevin Hassett as the next Fed Chair introduces a new policy dimension. Markets broadly interpret that shift as one that could favor lower rates and decisions driven by the pursuit of growth. If that transition becomes reality, the Fed may find itself leaning more heavily toward rate cuts in early 2026, even if the inflation and labor data argue for a more measured approach. In that environment, the biggest policy risk next year may not be that the Fed cuts too slowly — but that it cuts too quickly.
Cutting rates faster than conditions warrant could weaken the progress made on inflation, particularly now that goods prices are firming and wage dynamics remain unsettled. It could also raise questions about the Fed’s independence at a time when credibility is essential for anchoring expectations. Given the current state of discourse at the Fed, a more fragmented committee increases the likelihood that policy decisions feel less predictable as 2026 unfolds.
The labor market adds further complexity. Hiring has slowed, unemployment has risen and immigration has declined sharply, reducing labor supply and making it harder to find a job. The most likely path for the unemployment rate is a gradual rise, but there is also a meaningful chance that unemployment will move up more quickly. The direction of travel creates a reasonable case for additional easing, yet it also raises the possibility that the Fed will become more reactive to political and market pressures than to incremental changes in the data. Striking the right balance between support and restraint will be one of the defining challenges for the Fed and the market in the year ahead.
Turning to corporate America, one of the undeniable bright spots this year has been earnings. Third-quarter results were exceptional. Earnings growth effectively doubled earlier expectations, rising at a mid-teens pace, and importantly, the strength was far broader than just technology. Industrials, financials, consumer companies and a range of service industries delivered strong results, supported by better operating leverage, productivity gains and steady demand. This breadth is a healthy sign and reinforces that companies are still navigating this environment from a position of strength, even if they have not been the primary drivers of equity returns.
Looking ahead, though, we do not expect earnings to continue expanding at this speed. Margins are likely near their cyclical peak and as growth moderates in 2026, earnings should settle into a more sustainable rhythm. But markets do not require mid-teens earnings growth to advance. What matters more is clarity, stability and the ability of companies to protect profitability as conditions evolve.
That brings us to the Speedometers. Before reviewing this month’s dial changes, I want to take a moment to explain a refinement we are making to the scoring framework. The underlying methodology has not changed. The Speedometers remain a forward-looking tool designed to capture the potential impact of macro conditions on equity returns over the next six to nine months. What is changing is how we translate our committee discussions into the internal scoring within each color zone. This refinement allows the Speedometers to more dynamically reflect the committee’s assessments as conditions evolve. It does not introduce additional color changes beyond those announced this month, nor does it alter the philosophy behind the framework. It simply improves the alignment between our views and the way the Speedometers display their trajectory.
With that context, we have two dials that I want to discuss this month.
■ Previous Month ■ Current Month
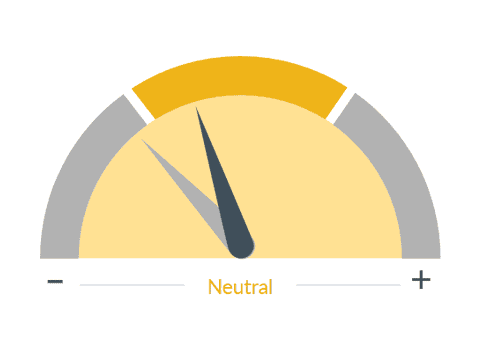
Geopolitical Risk
What we see
Geopolitical risk examines how geography and economics influence politics and international relations. Geopolitical risk includes the risk associated with international policy, trade, and global financial market stability, as well as wars, terrorist acts, tensions between states, and other events that can impact the normal and peaceful course of international relations.
Dial 1: Geopolitical Risk, 5:52— The Geopolitical Risk Speedometer is moving from red into yellow. Many of you may be asking, “How could we be optimistic about this while global tensions remain high?” The answer is that the current events in play are no longer exerting the same acute or one-directional pressure on equity markets that they did earlier this year. The Middle East situation has cooled, peace talks are advancing between Russia and Ukraine and trade dynamics are settling as more deals are reached. Most notably, the tension between the U.S. and China appears to have eased, or, at least, is likely to be neutral until the next negotiation point — still a year out. This easing of geopolitical pressure can be observed through energy markets, which have been stable. Global risks will never go away, but the expected equity market impact over the next several quarters is now more balanced. This indicator shouldn’t be about “fear”; it should reflect the impact from geopolitical risks on your portfolio, and the bottom line is that markets have adjusted to the current state and they appear less sensitive to these risks.
■ Previous Month ■ Current Month
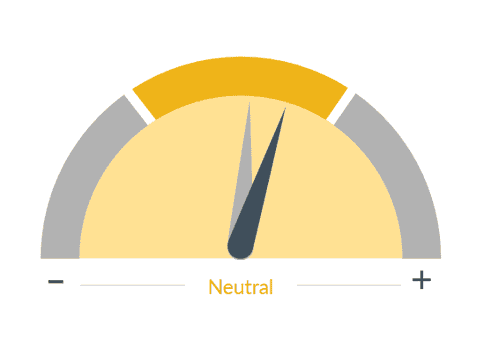
Corporate Profit Growth
What we see
Corporate earnings have a significant influence on the stock market as they ultimately drive stock prices. The value of securities is the present value of all future cash flows.
Dial 2: Corporate Profit Growth, 6:52— I also wanted to point out the Corporate Earnings Speedometer, which is rising within the yellow zone. The strength of third-quarter results — the doubling of expectations, the mid-teens growth rate and the widening of contributions outside of technology — supports a higher reading. While the move looks small compared to some of the recalibrations in scoring, we believe the earnings dynamic is a primary driver of equity returns, and, while it may not increase from here, even a pullback to average levels will provide a clear runway for equity markets.
Looking ahead into 2026, several themes stand out. U.S. equity valuations remain above long-term norms, which narrows the margin for disappointment, even as fundamentals remain solid. At the same time, international markets offer compelling combinations of valuation, fiscal spending and earnings potential. With growth broadening beyond the U.S., we’re finding a wider set of opportunities across equities than we have over recent years. This allows us to build portfolios with the same return expectations with better diversification.
Here at home, the economic expansion continues, price pressures are uneven, but manageable, and the Federal Reserve is positioned to support the transition if the labor market softens further. Corporate America enters 2026 from a position of strength, even if the pace of growth eases.
Important Information
RBC Rochdale is the brand name of RBC Rochdale, LLC an SEC-registered investment adviser and wholly-owned subsidiary of City National Bank. Registration as an investment adviser does not imply any level of skill or expertise. City National Bank is a subsidiary of the Royal Bank of Canada.
The information presented does not involve the rendering of personalized investment, financial, legal or tax advice. This presentation is not an offer to buy or sell, or a solicitation of any offer to buy or sell any of the securities mentioned herein.
Certain statements contained herein may constitute projections, forecasts and other forward-looking statements, which do not reflect actual results and are based primarily upon a hypothetical set of assumptions applied to certain historical financial information. Certain information has been provided by third-party sources and, although believed to be reliable, it has not been independently verified and its accuracy or completeness cannot be guaranteed.
Any opinions, projections, forecasts, and forward-looking statements presented herein are valid as of the date of this document and are subject to change.
Rochdale Speedometers are indicators that reflect forecasts of a 6-to-9-month time horizon. The colors of each indicator, as well as the direction of the arrows represent our positive/negative/neutral view for each indicator. Thus, arrows directed towards the (+) sign represents a positive view which in turn makes it green. Arrows directed towards the (-) sign represents a negative view which in turn makes it red. Arrows that land in the middle of the indicator, in line with the (0), represents a neutral view which in turn makes it yellow. All of these indicators combined affect RBC Rochdale’s overall outlook of the economy.
RBC Rochdale, its managed affiliates and subsidiaries, as a matter of policy, do not give tax, accounting, regulatory, or legal advice, and any information provided should not be construed as such.
All investing is subject to risk, including the possible loss of the money you invest. As with any investment strategy, there is no guarantee that investment objectives will be met and investors may lose money. Diversification does not ensure a profit or protect against a loss in a declining market. Past performance is no guarantee of future results.
©2025 RBC Rochdale, LLC. All rights reserved.
