
ROCHDALE PERSPECTIVES
Holiday Special
December 2025
- Filename
- Holiday All Perspectives December 2025.pdf
- Format
- application/pdf
.jpg "Charles Boettcher, CPWA®")


TRANSCRIPT
This month, we did a “holiday three-pack”, so to speak, combining Market, Fixed Income and Economic Perspectives into one video. So, get a fire going, get some hot cocoa, turn off the Hallmark Channel and snuggle up with us!
Market Perspectives
Charles Boettcher, CPWA®
Next month, we will do a thorough review as well as an outlook. For now, a quick look at the equity market, some comments on anticipated allocations changes and a note about taxes.
Equity markets are not far off from record levels, reflecting solid earnings and improving visibility on inflation and policy. The S&P 500 hit an all-time high on October 28, then dropped a little more than 5% to reach a near-term low on November 20. As of filming, it is up about 17-18% year-to-date.
Generally, financial markets are expected to remain volatile, driven by high valuations, uncertainty surrounding Federal Reserve actions and profit-taking. We recommend portfolios remain positioned toward high-quality issuers, emphasizing income stability and strong balance sheets. And, we recommend portfolios have an allocation to International Developed Equities in 2026.
The global economy is normalizing after a period of extraordinary U.S. leadership, with balance and diversification essential for investors. International markets offer diversification benefits, reduced concentration risk and attractive entry points that can enhance long-term return potential.
International markets are beginning to show improving momentum, with many developed economies experiencing an upswing in investment in infrastructure, defense and supply-chain modernization.
Significant Valuation Premium in U.S. Equity Markets
As of December 4, 2025. 1Price-to-Earnings multiples shown in U.S. dollar terms. 2The valuation discount is the Price-to-Earnings multiple difference between the S&P 500 and the MSCI ACWI ex U.S., which is a free-float adjusted market capitalization weighted index designed to measure the equity market performance of developed and emerging markets excluding the United States. Diversification may not protect against market risk or loss. Source: Bloomberg, Rochdale Research.
Chart 1, 2:09— As you are aware, U.S. equity valuations are high and now are at a significant premium over global market valuations — especially when compared to 20-year averages, as seen in the [Price-To-Earnings] chart. The [International Equity Valuation] chart illustrates the degree of the valuation discount.
U.S. vs. International: Sector Skew and Valuation Gap
Source: Bloomberg as of December 4, 2025.
Information is subject to change and is not a guarantee of future results.
Chart 2, 2:28— In addition to the relative valuation attractiveness, a case for diversification can be made: The sector weights in Technology, Financials and Industrials meaningfully differ between S&P 500 and MSCI All Country World Index, as seen on the [Price-To-Earnings] chart.
To finish off the year, allow me to revisit some earlier comments regarding capital gains for taxable portfolios. By many measures, it’s been a strong run in the S&P 500 with multiple stimulative factors propelling the run.
Starting in 2016, we had the Tax Cuts and Jobs Act, then deregulation, then the COVID recovery stimulus, near zero accommodative rates, fiscal stimulus, AI capex spending and more. Six of the past seven years have seen higher than average returns in the S&P 500; at this point, for many portfolios, there is not much more we can do to mitigate or further defer a capital gains tax bill, not many losses to take. In addition, as we make changes such as shifting some money from U.S. stocks to international stocks, further gains will be realized. Make sure this is a topic of discussion in your year-end and beginning-of-the-year reviews with your respective portfolio manager.
Economic Perspectives
Paul Single
Despite the fact that the Fed just cut the Federal Funds rate by 25 basis points at their December meeting, the Fed is in a difficult position.
They're trying to determine the appropriate policy response to the economic developments. On one hand, job growth has slowed to a trickle, indicating the Fed should continue lowering the federal funds rate. Yet on the other hand, the pace of economic growth remains robust, but inflation, which is hovering around 3%, is well above the target rate of 2%. That would encourage them to halt their rate cuts. What are they to do?
Well, to get a better understanding, let’s take a look at some charts.
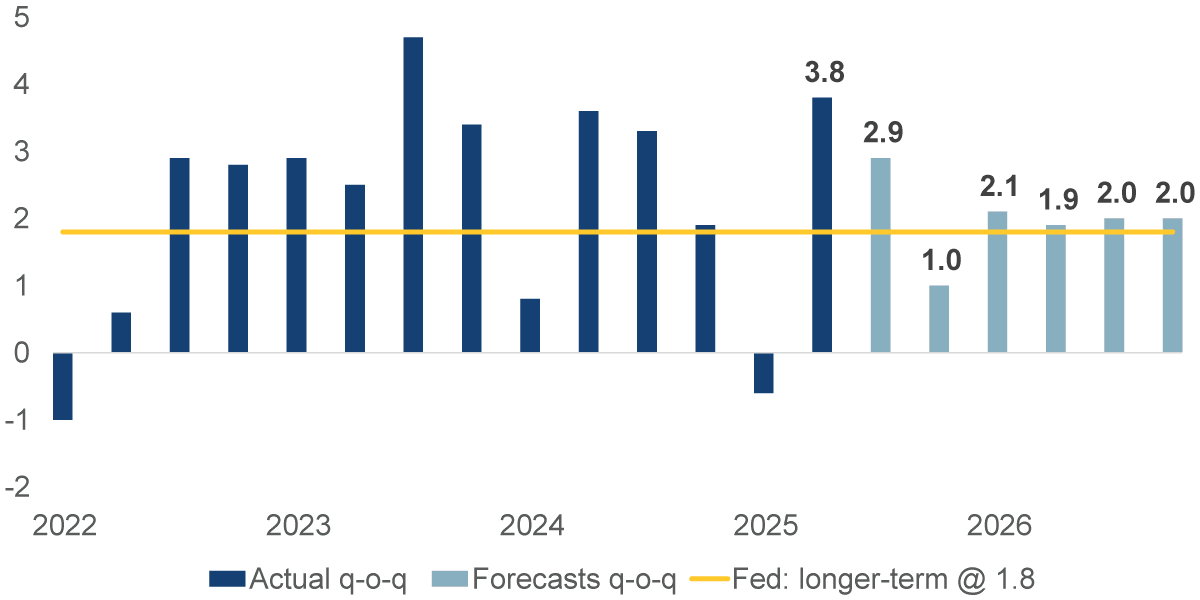
GDP: Actual & Forecast (Bloomberg Composite of Forecasts)
% change q-o-q, seasonally adjusted annualized rate
Data as of: December 10, 2025.
Source: Bureau of Economic Analysis, Bloomberg Composite of economic Forecasts.
Information is subject to change and is not a guarantee of future results.
Chart 3, 4:45— As a backdrop, this first chart shows GDP growth. The columns represent the quarterly change, with the dark blue columns representing history and the bright blue columns representing Wall Street’s forecasts. The horizontal yellow line shows the Fed’s estimate of the ideal growth rate, 1.8%. It is strong enough for full employment, but not strong enough to push inflation above its target rate of 2%.
As you can see, economic growth has been strong. The last dark blue column was the second quarter of this year, with a powerful 3.8% growth rate. That was due to a cutback in imports due to the newly enacted tariffs and strong consumer spending. The next column, in light blue, is for the third quarter of this year and is expected to be 2.9%, another firm number.
There is an expectation of dip, just 1% growth in the fourth quarter, due in part to the federal government shutdown and a pullback in consumer spending. But all four quarters of next year are expected to average around a healthy 2%.
Usually, with strong economic growth, payroll growth is healthy as well. But that has not been the case of late.
Nonfarm Payrolls
'000, seasonally adjusted

Data as of: December 10, 2025.
Source: Bureau of Labor Statistics.
Information is subject to change and is not a guarantee of future results.
Chart 4, 6:00— The columns in this chart shows the monthly change in nonfarm payrolls, which have been declining. In the past few months, there have been two months of declines in the number of people working. The average monthly gain for the past three months is a paltry 62,000, well below the 2024 average monthly gain of 168,000 and 216,000 in 2023.
The labor market is experiencing a unique phenomenon: both labor demand and supply are slowing. Much of the recent decline is attributed to employers’ economic policy uncertainty and a lack of qualified workers due to immigration policies.
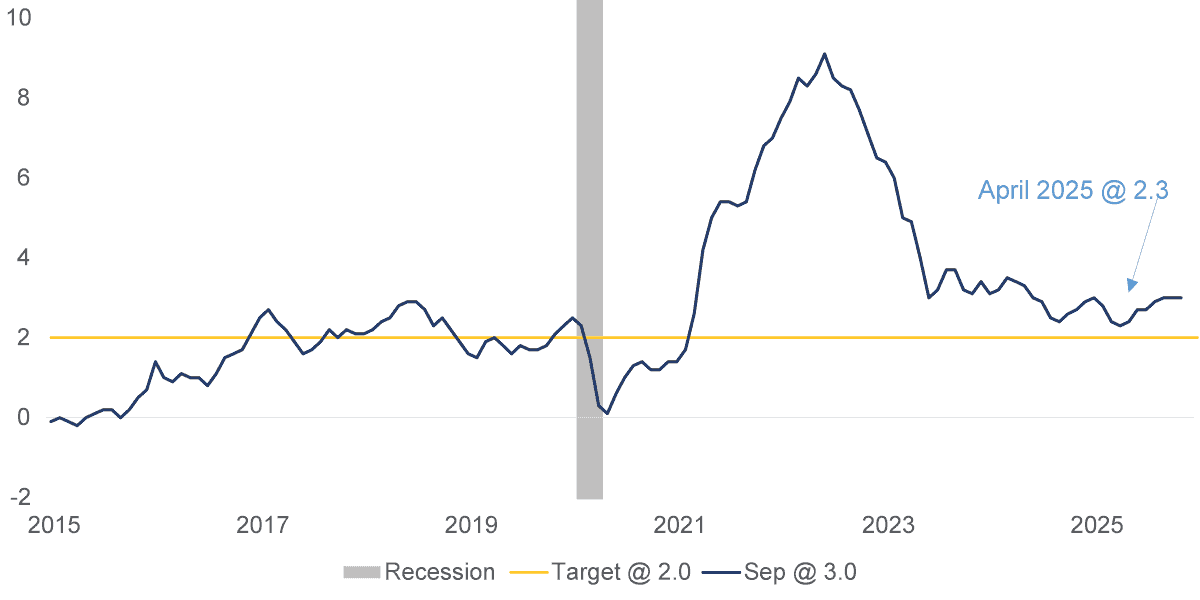
Consumer Price Index
%, y-o-y
Data as of: December 10, 2025.
Source: Bureau of Labor Statistics.
Information is subject to change and is not a guarantee of future results.
Chart 5, 6:39— Here is a chart of inflation, more specifically, the consumer price index. After hitting a cycle low of 2.3% in April, it has bounced up to 3% in September, with services and shelter prices contributing the most upward pressure. Definitely not what the Fed wants.
So, what is the Fed to do? They have a Congressional mandate to support the goals of maximum employment and stable prices. For the past few years, they have been focused heavily on the inflation mandate, which has been above its target rate of 2% for five years. They didn’t need to worry about labor, since payroll growth was robust. But with the sharp decline in payroll growth over the past few months, they are now worried.
Although economic growth is strong, payroll growth is often a harbinger of an economic contraction. The Fed, of course, wants to prevent that from happening, since fixing a contraction in the economy is much more complex than fixing inflation. This has led the Fed to focus on labor and become less restrictive in its monetary policy.
Federal Funds & Neutral Fed Funds
%, not seasonally adjusted

Data as of: December 10, 2025.
Source: Federal Reserve.
Information is subject to change and is not a guarantee of future results.
Chart 6, 7:42— The dark blue line in this chart shows the time series of the federal funds rate, currently 3.625%, a decline of 175 basis points in the past year or so.
The yellow line is the Federal Reserve’s view of the neutral federal funds rate. It is a theoretical interest rate when monetary policy is neither stimulating nor restricting economic growth. It is the rate that allows the economy to operate at its full potential with full employment and stable inflation. Whenever the dark blue line is above the yellow line, monetary policy is considered restrictive; when below, it is considered accommodative.
Monetary policy is slightly restrictive, at 5/8 of a percentage point above neutral. In 2026, the Fed plans on cutting interest rates another 25 basis points, bringing the federal funds rate to near neutral.
The Fed’s greater accommodation is one of several reasons we believe the economy will prosper in 2026. Although the economy is still adjusting to changes in policies regarding the trade war, tariffs, taxes and immigration, much of the fear or concern has been fading.
Next year, we believe the economy will also benefit from fiscal policy, which should be a powerful tailwind bringing bigger tax refunds and an increase in investment in capital expenditures. We expect demand for workers to pick up after the “hiring freeze” triggered by the Liberation Day tariff announcement.
Fixed Income Perspectives
Michael Taila, CPWA®
With only a few weeks remaining in the year, it’s safe to say 2025 has been a strong one for fixed income, with every major sector delivering positive — and in some cases, outstanding — total returns, reminding investors of the diversification benefits and income potential fixed income brings to portfolios.
Breaking it down: Global high-yield and emerging markets have led the way as attractive starting yields and periods of U.S. dollar weakness drew investors to the asset class; while U.S. Treasuries posted solid gains as tariff and deficit concerns subsided and the Federal Reserve shifted toward an easing stance.
Fixed Income Year-to-Date Asset Class Returns
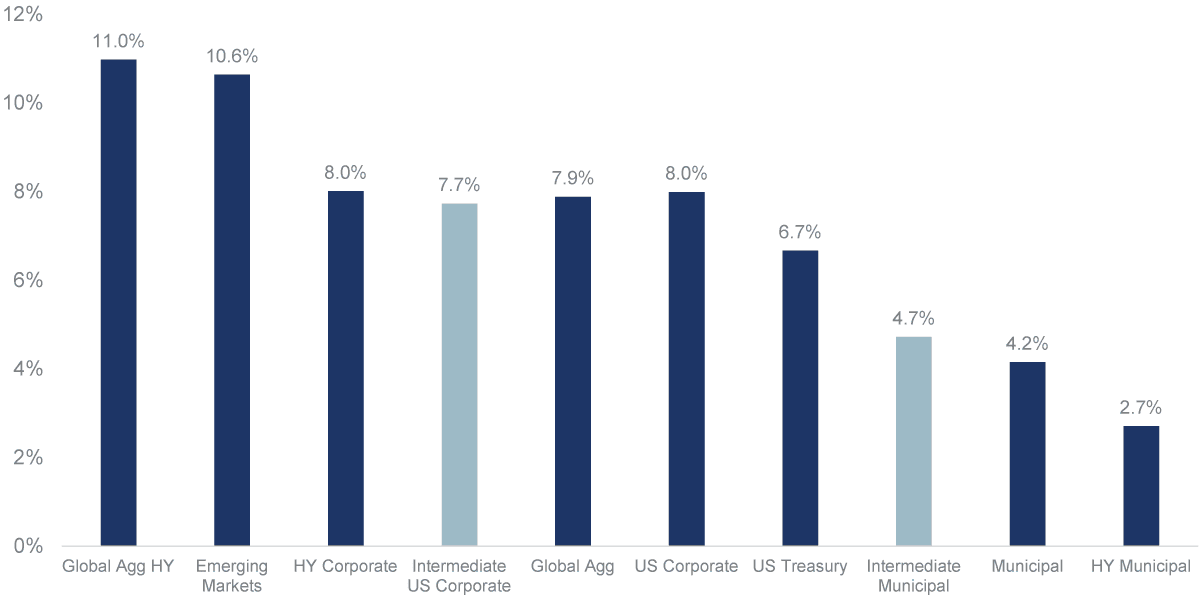
Sources: Bloomberg HY Global Aggregate Index, Bloomberg Global Aggregate Index, Bloomberg EM USD Aggregate Index, Bloomberg US Corporate Index, Bloomberg US Corporate High Yield Index, Bloomberg Intermediate Corporate Bond Index, Bloomberg US Treasury Index, Bloomberg Intermediate Municipal Index, Bloomberg Municipal Bond Index, Bloomberg High Yield Municipal Bond Index as of 11/30/2025.
Chart 7, 9:58— Investment-grade and high-yield corporate bonds performed exceptionally well as spreads tightened throughout the year and were supported by stable fundamentals, declining interest rate volatility and strong demand. Finally, after struggling for much of the year, attractive tax-adjusted yields and supportive valuations have helped municipal bonds finish the year on strong footing.
As we turn our focus to the new year, we expect 2026 to be another good year for bond investors. The economic picture points to resilient growth and modest improvements to inflation, but a softening labor market. We believe this will prompt the Federal Reserve to cut rates a few more times, bringing the Fed Funds rate to 2.75%-3.25% by year-end. Further out the curve, growth, inflation and increasing Treasury supply will keep 10-year Treasury yields’ range bound between 3.75% and 4.25%. Put another way, we anticipate the yield curve to steepen as the Fed cuts short-term rates while longer-term yields stay anchored.
Current Fixed Income Asset Class Yields vs. 5-Yr Averages
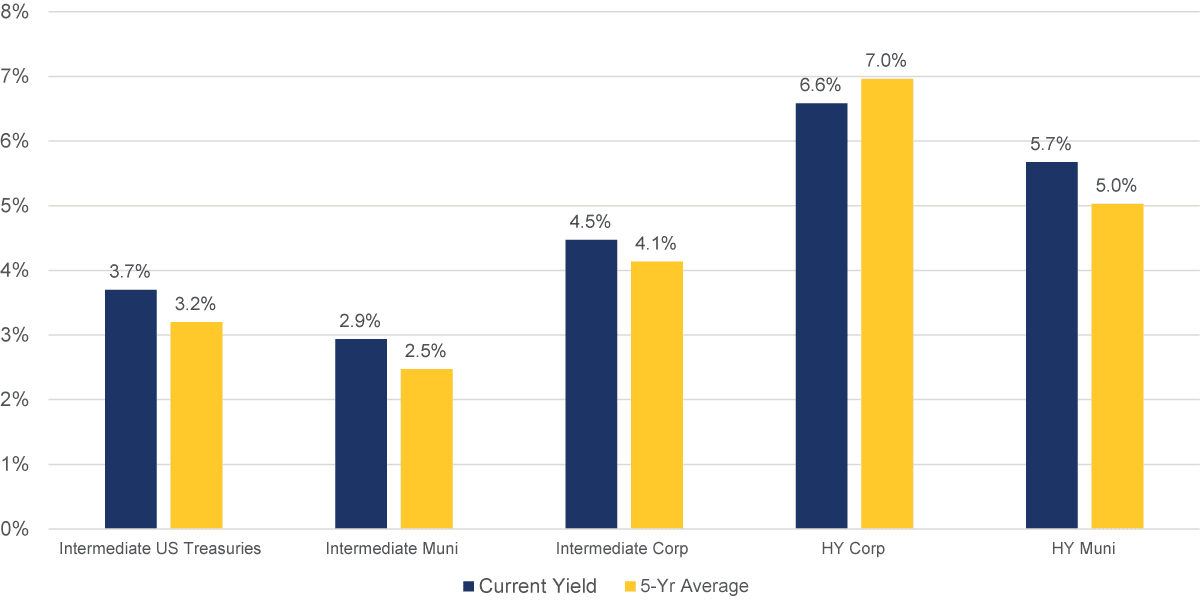
Sources: Bloomberg Municipal Bond: High Yield (non-Investment Grade) TR Index, Bloomberg US Corporate High Yield Total Return Index, Bloomberg Municipal Bond Inter-Short 1-10Y TR Index, Bloomberg Intermediate Corporate Total Return Index, Bloomberg US Intermediate Treasury TR Index as of 12/8/2025. There is no guarantee that investment objectives will be met.
Chart 8, 11:03— A solid economic backdrop and meaningfully steeper curve points to a 2026 return environment that is constructive but more modest than the gains experienced this year. Starting yields remain appealing on a historical basis, even after this year’s rally and are still high enough to offer the prospect of positive real returns as inflation settles. Credit spreads remain tight, supported by strong balance sheets and low default risk. But rising supply across government, corporate and securitized markets will require greater selectivity while at the same time pressure on spreads could present meaningful opportunities. Municipal bonds also enter 2026 in a healthy position with a steep curve and attractive tax-adjusted yields. While credit fundamentals remain durable, supply is expected to be heavy, which we anticipate will provide opportunities throughout the year.
To summarize, our outlook points to another positive year for bond investors, though 2026 will be a year with a focus on income accrual, curve placement and selectivity and less of a focus on the tailwind from falling yields.
Important Information
RBC Rochdale is the brand name of RBC Rochdale, LLC.
RBC Rochdale, LLC is an SEC-registered investment adviser and wholly-owned subsidiary of City National Bank. Registration as an investment adviser does not imply any level of skill or expertise. City National Bank is a subsidiary of the Royal Bank of Canada.
The information presented does not involve the rendering of personalized investment, financial, legal, or tax advice. This presentation is not an offer to buy or sell, or a solicitation of any offer to buy or sell any of the securities mentioned herein.
The views expressed represent the opinions of RBC Rochdale, LLC which are subject to change and are not intended as a forecast or guarantee of future results. Stated information is provided for informational purposes only, and should not be perceived as personalized investment, financial, legal or tax advice or a recommendation for any security. It is derived from proprietary and non-proprietary sources which have not been independently verified for accuracy or completeness. While Rochdale believes the information to be accurate and reliable, we do not claim or have responsibility for its completeness, accuracy, or reliability. Statements of future expectations, estimates, projections, and other forward-looking statements are based on available information and management’s view as of the time of these statements. Accordingly, such statements are inherently speculative as they are based on assumptions which may involve known and unknown risks and uncertainties. Actual results, performance or events may differ materially from those expressed or implied in such statements.
All investing is subject to risk, including the possible loss of the money you invest. As with any investment strategy, there is no guarantee that investment objectives will be met and investors may lose money. Diversification does not ensure a profit or protect against a loss in a declining market.
Equity investing strategies & products. There are inherent risks with equity investing. These risks include, but are not limited to stock market, manager or investment style. Stock markets tend to move in cycles, with periods of rising prices and periods of falling prices.
Fixed Income investing strategies & products. There are inherent risks with fixed income investing. These risks include, but are not limited to, interest rate, call, credit, market, inflation, government policy, liquidity or junk bond risks. When interest rates rise, bond prices fall. This risk is heightened with investments in longer-duration fixed income securities and during periods when prevailing interest rates are low or negative.
© 2025 RBC Rochdale, LLC. All rights reserved.
Index Definitions
The Standard & Poor’s 500 Index (S&P 500) is a market capitalization-weighted index of 500 common stocks chosen for market size, liquidity and industry group representation to represent U.S. equity performance.
The MSCI All Country World Index (ACWI) is a global stock index that encompasses nearly 3,000 companies from 23 developed countries and 25 emerging markets.
Bloomberg HY Global Aggregate Index: A key benchmark for the global junk bond market, tracking investment-grade debt from developed & emerging markets (US, Europe, EM) with ratings below Ba1/BB+. It's a multi-currency index reflecting global corporate risk appetite, combining US, European, and Emerging Market high-yield bonds, distinct from the Investment Grade Bloomberg Global Aggregate (Global Agg).
Bloomberg Global Aggregate Index: The Bloomberg Global Aggregate Index is the premier benchmark for global investment-grade, fixed-rate debt, measuring performance across 24 developed and emerging market currencies, encompassing government, corporate, and securitized bonds.
Bloomberg EM USD Aggregate Index: The Bloomberg EM USD Aggregate Index tracks fixed and floating-rate debt from Emerging Markets (EM) issuers, denominated in U.S. dollars, covering sovereign, quasi-sovereign, and corporate bonds, providing a broad benchmark for hard currency EM debt performance.
Bloomberg US Corporate Index: The Bloomberg US Corporate Index is a benchmark tracking the U.S. investment-grade, fixed-rate, taxable corporate bond market, including bonds from U.S. and non-U.S. issuers in industrial, utility, and financial sectors, with at least one year to maturity.
Bloomberg US Corporate High Yield Index: The Bloomberg US Corporate High Yield Index tracks the U.S. dollar-denominated, fixed-rate corporate bond market for non-investment grade ("junk") bonds, including various types like callable, putable, and 144A securities, requiring ratings below Ba1/BB+/BB+ from major agencies, with minimum outstanding face value and excluding emerging market issuers to measure this riskier segment of the credit market.
Bloomberg Intermediate Corporate Bond Index: The Bloomberg U.S. Intermediate Corporate Bond Index tracks investment-grade, fixed-rate, U.S. dollar-denominated corporate bonds from U.S. and non-U.S. issuers, specifically those with maturities between 1 year and just under 10 years (1 to 9.999 years).
Bloomberg US Treasury Index: The Bloomberg US Treasury Index is a benchmark tracking U.S. dollar-denominated, fixed-rate, nominal US government debt with at least one year to maturity, excluding bills (short-term) and STRIPS (zero-coupon), providing a key measure of the investment-grade Treasury market for performance tracking and risk management.
Bloomberg Intermediate Municipal Index: The Bloomberg Intermediate Municipal Index tracks the U.S. investment-grade, tax-exempt bond market for securities with maturities typically between 1 to 10 years (or 1 to 15 years depending on the specific sub-index), serving as a benchmark for high-quality, shorter-to-intermediate duration municipal debt like general obligations and revenue bonds, excluding taxable issues.
Bloomberg Municipal Bond Index: The Bloomberg Municipal Bond Index (often the U.S. version) is a key benchmark measuring the performance of the U.S. tax-exempt bond market, covering investment-grade, U.S. dollar-denominated bonds like general obligations, revenue bonds, and insured issues, acting as a broad gauge for this long-term, fixed-income sector, and including reinvestment of income.
Bloomberg High Yield Municipal Bond Index: The Bloomberg Municipal High Index is a measure of the U.S. municipal tax-exempt non-investment grade bond market.
Bloomberg Municipal Bond Inter-Short 1-10Y TR Index, The Bloomberg Municipal Short/Intermediate Index is a measure of the U.S. municipal tax-exempt investment grade bond market.
Bloomberg Intermediate Corporate Total Return Index: The Bloomberg Intermediate Corporate Total Return Index tracks the performance of investment-grade, fixed-rate, U.S. dollar-denominated corporate bonds with maturities between 1 and 10 years, including issues from U.S. and non-U.S. industrial, utility, and financial firms, measuring total returns from price changes and coupon payments.
Bloomberg US Intermediate Treasury TR Index: The Bloomberg US Intermediate Treasury TR Index (Total Return) tracks the performance of investment-grade, U.S. dollar-denominated, fixed-rate U.S. Treasury bonds with maturities between one year and less than ten years, representing the intermediate segment of the Treasury market, focusing purely on government debt for a benchmark of risk-free assets.
Bloomberg Municipal Bond: High Yield (non-Investment Grade) TR Index: The Bloomberg Municipal Bond: High Yield (non-Investment Grade) TR Index (often just the "High Yield Muni Index") tracks the performance (Total Return, or TR) of U.S. dollar-denominated, fixed-rate, tax-exempt municipal bonds rated below investment grade (BB+/Ba1 or lower) from all 50 states and qualifying territories, measuring higher-risk, higher-potential-return bonds like those from nursing homes or development projects, distinct from typical investment-grade munis.
Bloomberg US Corporate High Yield Total Return Index: The Bloomberg US Corporate High Yield Total Return Index tracks USD-denominated, non-investment-grade, fixed-rate corporate bonds from the U.S., serving as a benchmark for riskier debt, defined by middle ratings of Ba1/BB+/BB+ or lower from major agencies, excluding emerging markets debt, and measuring overall price changes plus reinvested interest.
Definitions
The Consumer Price Index (CPI) measures the monthly change in prices paid by U.S. consumers. The Bureau of Labor Statistics (BLS) calculates the CPI as a weighted average of prices for a basket of goods and services representative of aggregate U.S. consumer spending.
Gross domestic product (GDP) is the total monetary or market value of all the finished goods and services produced within a country’s borders in a specific time period.
Muni Bond: A municipal bond is a debt security issued by a state, municipality or county to finance its capital expenditures, including the construction of highways, bridges or schools. These bonds can be thought of as loans that investors make to local governments.
The seven tech titan stocks are a group of high-performing and influential companies in the U.S. stock market: Alphabet, Amazon, Apple, Meta Platforms, Microsoft, NVIDIA and Tesla.
