
-
Economic Perspectives
The Housing Market: Stuck between Strong Demand and High Prices and Mortgage Rates
May 2025
- Filename
- Economic Perspectives May 2025.pdf
- Format
- application/pdf

TRANSCRIPT
This month, we're reviewing the housing sector. It's an important sector for many of our clients since the home tends to be the most valuable asset on their balance sheet. In the post-pandemic world, there have been some major shifts in many of the components of housing. So, this month's video will delve into some of those important issues.
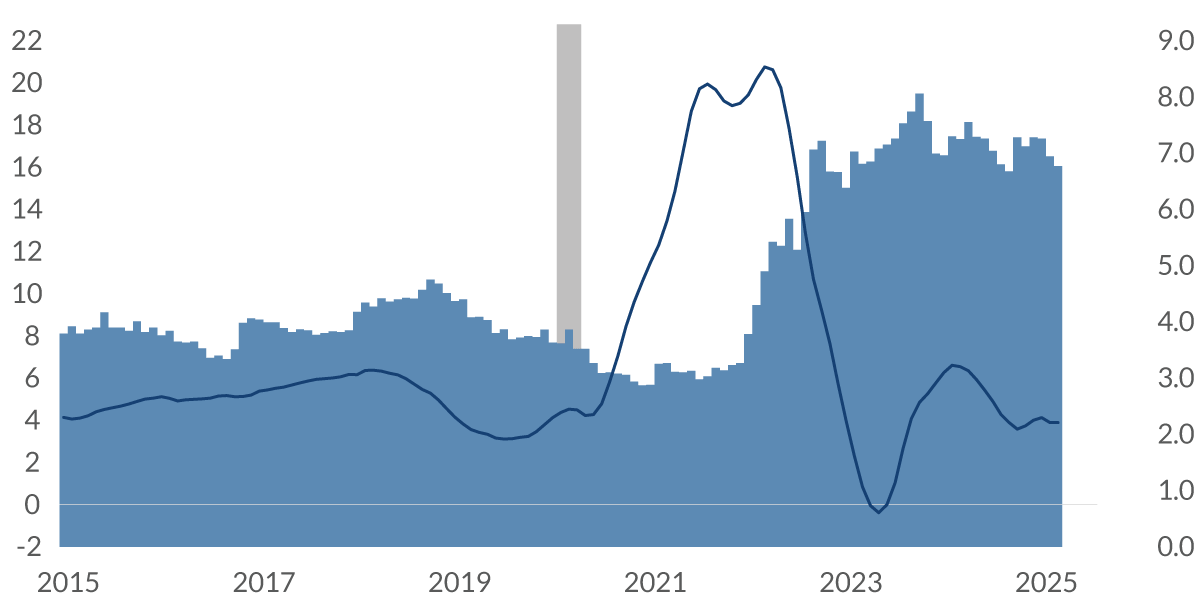
Home Prices and Mortgage Rates
% change in price y-o-y, % for 30-year fixed rate mortgage
Data current as of May 21, 2025
Source: S&P CoreLogic Case Shiller, Bankrate.com
Information is subject to change and is not a guarantee of future results.
Chart 1, 0:32– This chart shows both the annual price increase of homes and the prevailing mortgage rate. The price increases in the dark blue line, while the mortgage rate is shown in the shaded area. As you can see, prior to the pandemic, the annual increase in home prices averaged about 5% per year. Following the pandemic, the Fed engaged in quantitative easing, and longer-term interest rates fell — including the rate on mortgages, which dropped to 3%. This, of course, helped push up the price of homes.
As you can see, in 2021 and the early parts of 2022, prices rallied a lot, ending up around 20% year over year. But when the Fed started to raise interest rates to combat inflation, mortgage rates moved up, and price appreciation fell. In the past two years or so, price gains have settled back in to around their pre-pandemic pace.
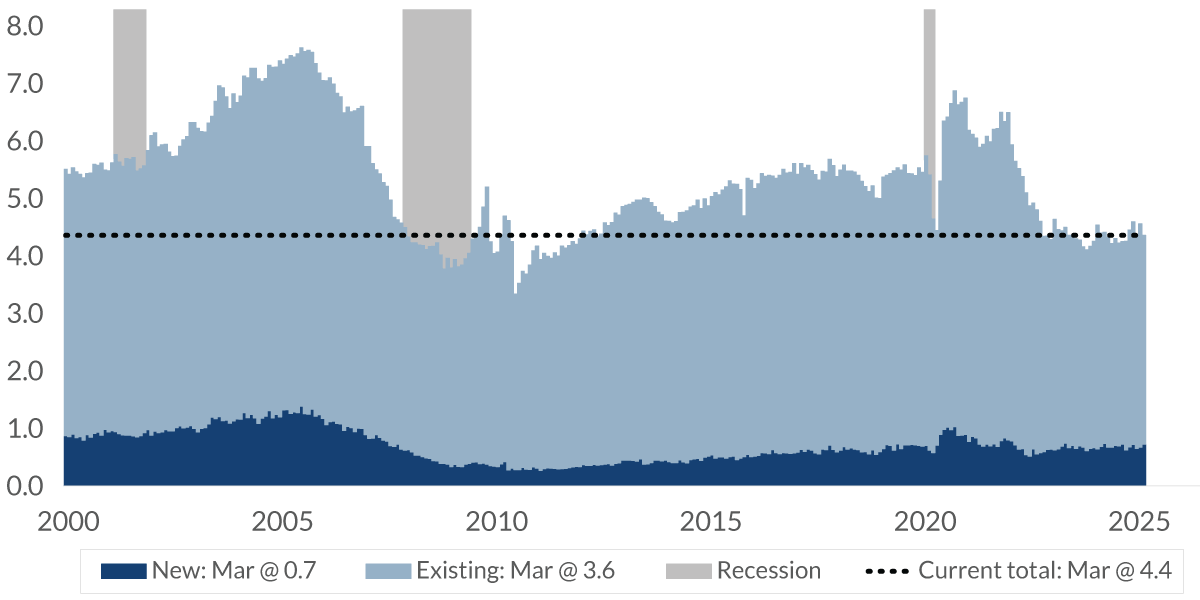
New & Existing Home Sales: Single Family
units, millions, seasonally adjusted annual rate
Data current as of May 21, 2025
Source: U.S. Census Bureau, National Association of Realtors
Information is subject to change and is not a guarantee of future results.
Chart 2, 1:30– With mortgage rates around 7%, home sales have fallen in the past few years.
In this chart, which takes a broader perspective and a longer-term view dating back to 2000, you can see new-home sales in dark blue. They've averaged about 10% of total sales. That has been a relatively stable amount for the last few years. But now look at existing-home sales, shown here in lighter blue. As you can see, these sales, which make up the lion's share of home sales have seen a significant decline in the past couple of years, with the total number dropping to about 4.4 million annually. That's a historically low level.
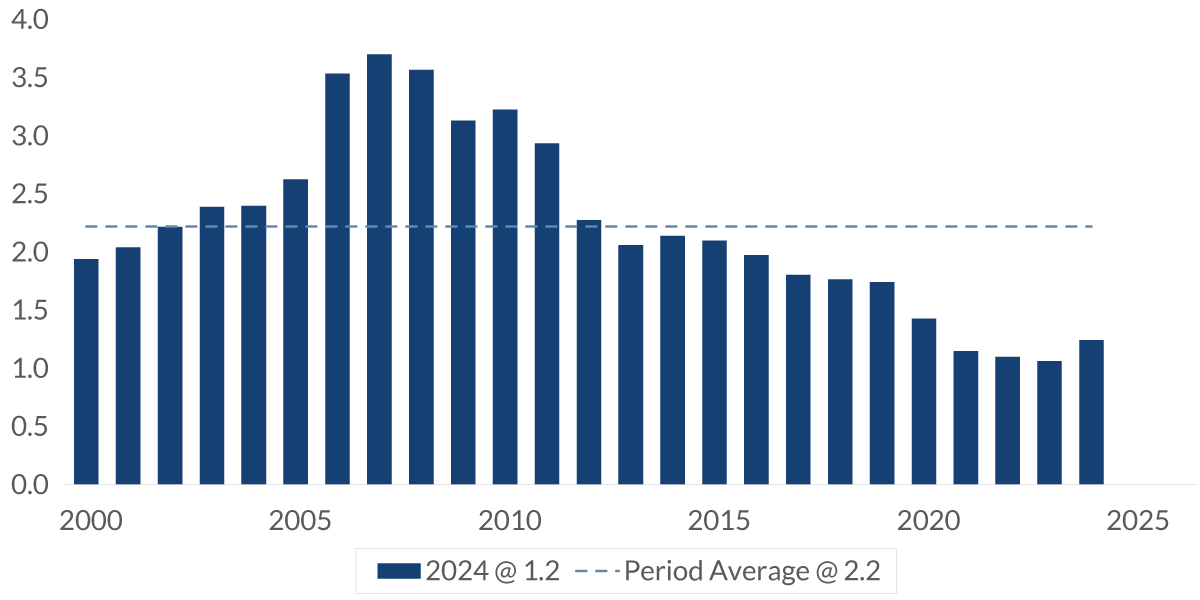
Inventory of Existing Homes for Sale
millions, not seasonally adjusted
Data current as of May 21, 2025
Source: National Association of Realtors
Information is subject to change and is not a guarantee of future results.
Chart 3, 2:12– One of the reasons for this lower pace of existing home sales is the decline in inventory.
In the past few years, inventory has averaged just about one million homes for sale, while the longer-term average has been about twice that level. The reason is simple: Many existing homeowners have locked-in low mortgage rates, and they're in no hurry to change homes and take on a relatively higher financing cost.
Relative Home Cost
%, median existing home price/annual median family income
Data current as of May 21, 2025
Source: U.S. Census Bureau, National Association of Realtors
Information is subject to change and is not a guarantee of future results.
Chart 4, 2:36– Another reason for the slower pace in sales is the cost of a home has also risen. In this chart, we’ll look at the price of the home relative to household income. Currently, the median-priced home relative to household income is near record levels, costing more than four times the annual income of a median-income family.
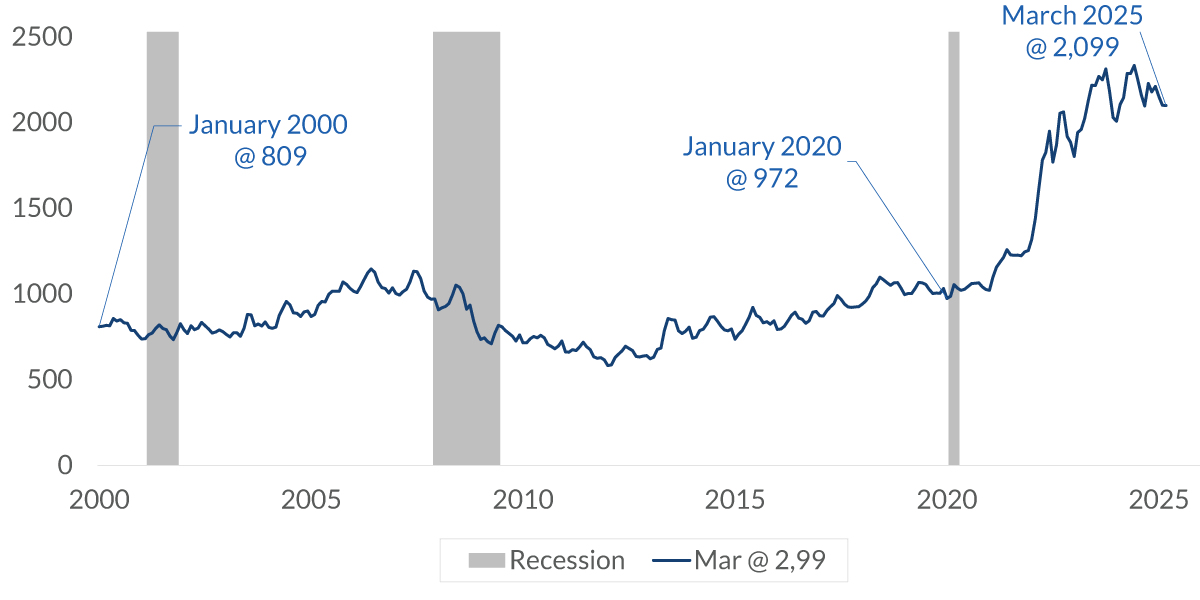
Monthly Mortgage Payment - Median Price of Existing Home
$, 30-year fixed rate mortgage, 80% financing
Data current as of May 21, 2025
Source: National Association of Realtors, Bankrate.com, CNR Research
Information is subject to change and is not a guarantee of future results.
Chart 5, 2:56– Combine that higher purchase price is with the higher mortgage rate, and you can see why the monthly mortgage payment has skyrocketed.
Look at this chart. On the left-hand side, you’ll see that back in 2000, the monthly mortgage payment for a medium-priced home was just over $800. Twenty years later, just before the pandemic, that payment had increased to $972 dollars, primarily due to price appreciation of the home. This represents an annual increase of 18% over 20 years. But now, look at the change since then. The monthly payment is now up to $2,099 per month. That represents an increase of 116% in just five years.
So, as these numbers show, it's become decisively more expensive for those looking to buy a home than what we've seen in the past.
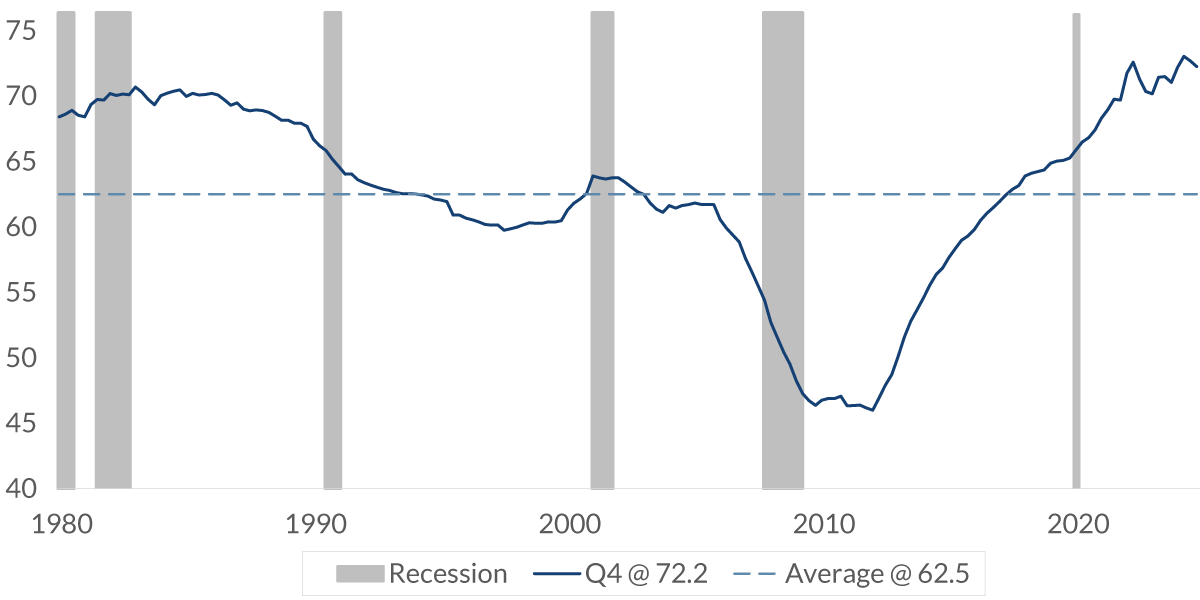
Owners' Equity in Real Estate as a Percent of Household Real Estate
%, not seasonally adjusted
Data current as of May 21, 2025
Source: Federal Reserve Bank
Information is subject to change and is not a guarantee of future results.
Chart 6, 3:54– But there is a silver lining — at least for those who bought a home with a lower fixed-rate mortgage five or more years ago: Those lucky homeowners are enjoying substantially increased equity in their homes. This chart shows average home equity, which is near record highs. Greater home equity, of course, helps strengthen a homeowner's balance sheet and helps to reduce the risk of mortgage payment delinquency at some point in the future.
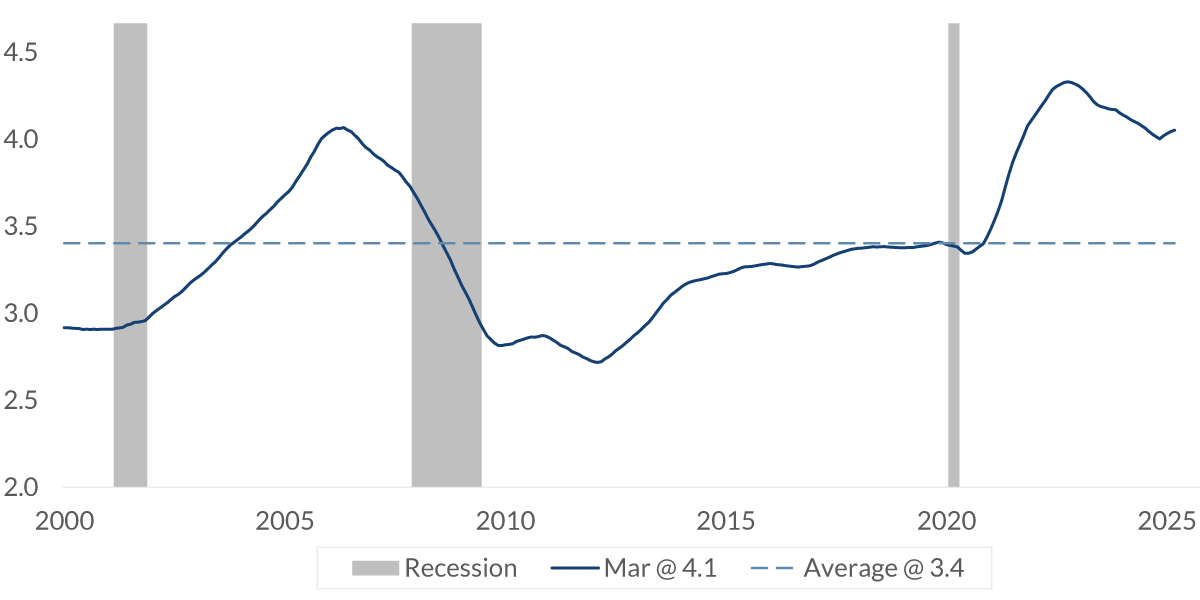
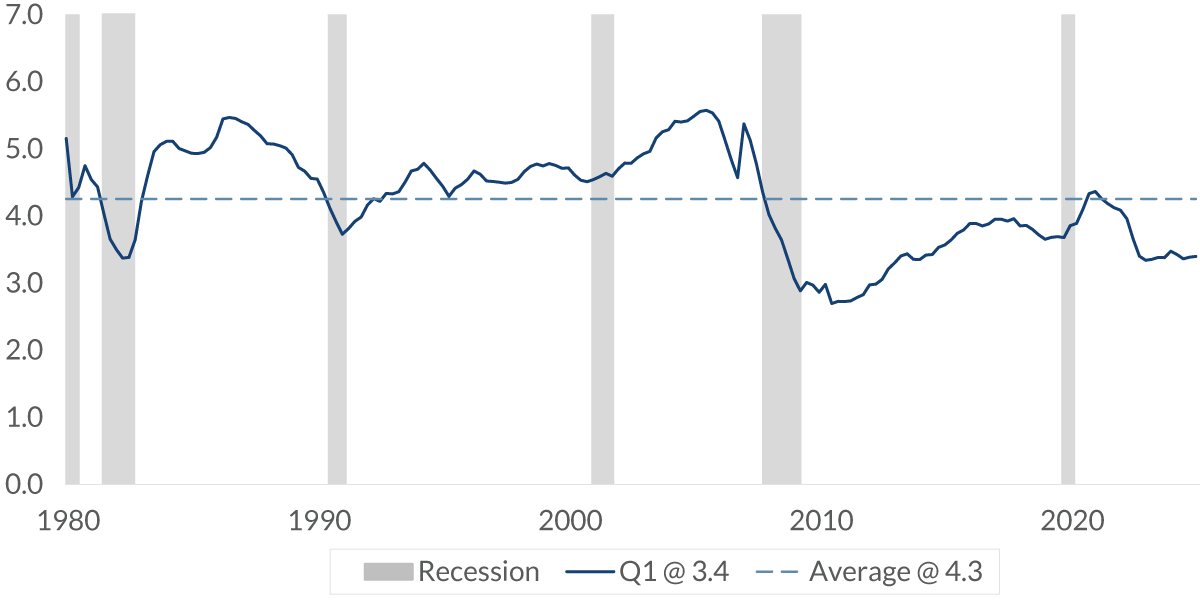
GDP: Residential Investment as a Percent of GDP
%, seasonally adjusted, annual rate
Data current as of May 21, 2025
Source: Bureau of Economic Analysis
Information is subject to change and is not a guarantee of future results.
Chart 7, 4:12– So, what does this mean for the economy?
Well, in the GDP calculation, housing makes up just 3.4% of today’s GDP. That's a substantial decline from the long-term average of 4.3%. So, it has been reduced by roughly one quarter. In the past two years, home sales have been in the doldrums for several reasons. There are the ongoing affordability challenges for would-be homebuyers, including elevated mortgage rates and home prices that are high relative to household income. These factors have also led to a lack of home switchers — along with, more recently, a high degree of uncertainty about the direction of the economy.
For homebuyers, there is some good news in that inventories have increased 20% in the last year. This might be the reason why price increases have slowed.
Important Information
The information presented does not involve the rendering of personalized investment, financial, legal, or tax advice. This presentation is not an offer to buy or sell, or a solicitation of any offer to buy or sell any of the securities mentioned herein.
Certain statements contained herein may constitute projections, forecasts and other forward-looking statements, which do not reflect actual results and are based primarily upon a hypothetical set of assumptions applied to certain historical financial information. Viewers are cautioned that such forward-looking statements are not a guarantee of future results, involve risks and uncertainties, and actual results may differ materially from those statements. Certain information has been provided by third-party sources and, although believed to be reliable, it has not been independently verified and its accuracy or completeness cannot be guaranteed.
Any opinions, projections, forecasts, and forward-looking statements presented herein are valid as of the date of this video’s distribution and are subject to change.
Past performance or performance based upon assumptions is no guarantee of future results.
All investing is subject to risk, including the possible loss of the money you invest. As with any investment strategy, there is no guarantee that investment objectives will be met and investors may lose money. Diversification does not ensure a profit or protect against a loss in a declining market.
City National Rochdale, LLC is an SEC-registered investment adviser and wholly-owned subsidiary of City National Bank. Registration as an investment adviser does not imply any level of skill or expertise. City National Bank is a subsidiary of the Royal Bank of Canada.
© 2025 City National Bank. All rights reserved.
NON-DEPOSIT INVESTMENT PRODUCTS ARE: • NOT FDIC INSURED • NOT BANK GUARANTEED • MAY LOSE VALUE
