
-
Economic Perspectives
Private Labor Reports
November 2025
- Filename
- Economic Perspectives November 2025.pdf
- Format
- application/pdf

TRANSCRIPT
With the federal government having been shut down for 43 days, almost all government economic data was not being collected or published. Fortunately, there is data from private entities that was available to help guide the financial markets. Although this data has been available for years, the financial markets and clients paid scant attention to it, instead focusing on government-issued data. But now, with private data the only thing the markets can use as a guidepost, clients have been asking questions about it. So, although government data will begin to be released, we thought it would be a good idea to review a few of the private labor reports. Let’s take a look at some charts.
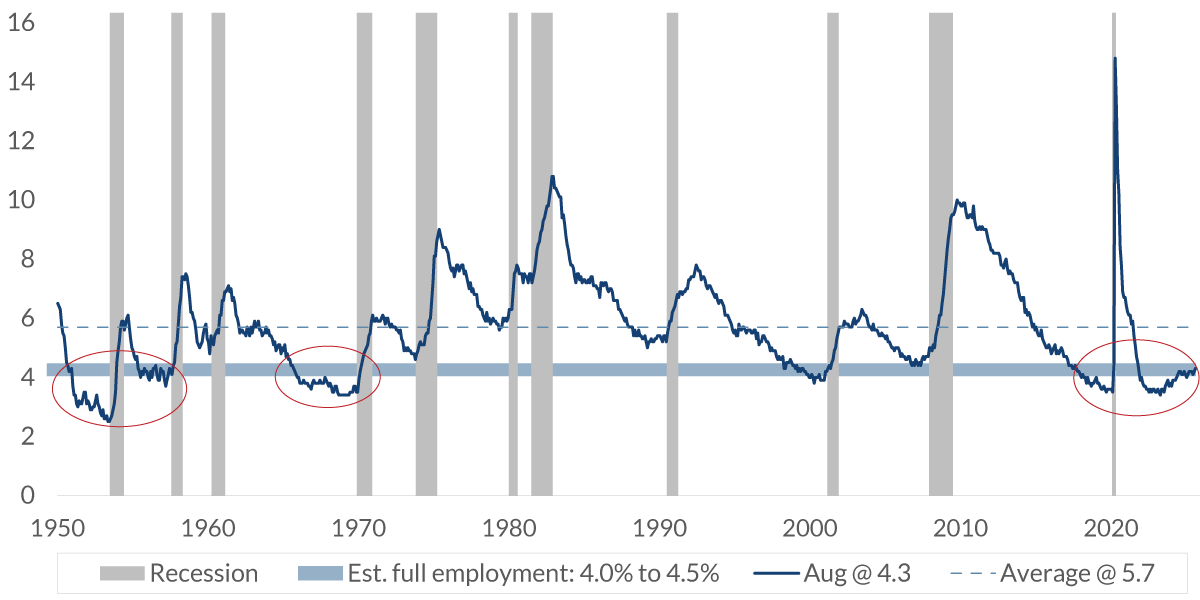
Unemployment Rate
%, seasonally adjusted
Data current as of November 20, 2025.
Source: Bureau of Labor Statistics
Information is subject to change and is not a guarantee of future results.
Chart 1, 0:56– As a reminder of where the labor market stands, the September data was released on November 20. This chart shows that the unemployment rate is at just 4.4%, indicating a robust labor market. It is within the range of 4.0% to 4.5%, a level that economists consider to represent full employment.
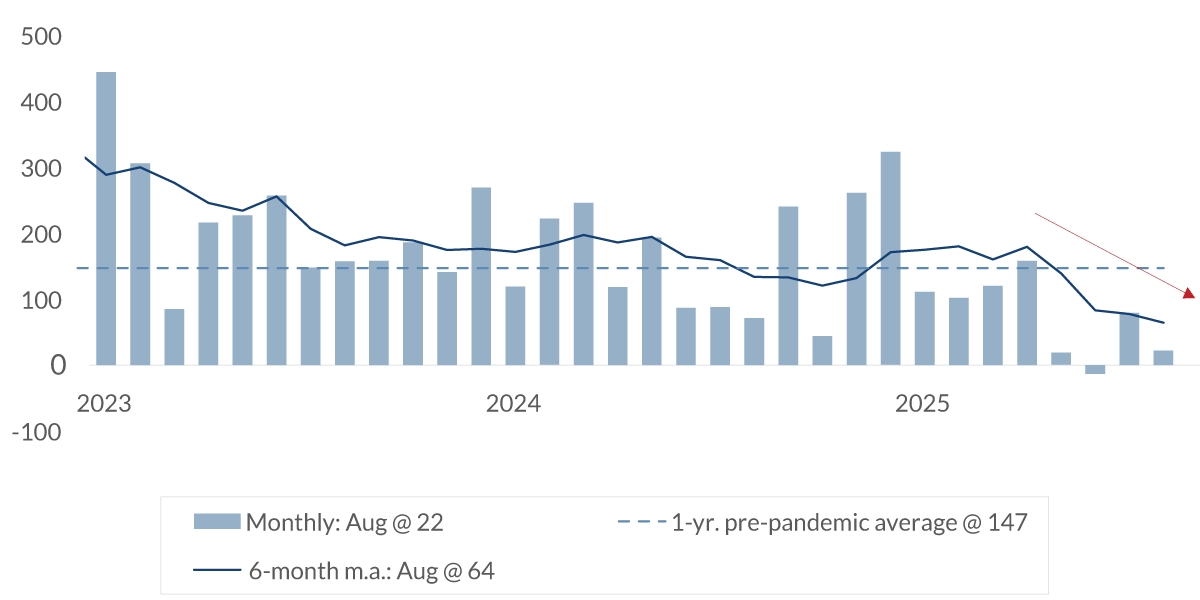
Nonfarm Payrolls
'000, seasonally adjusted
Data current as of November 20, 2025.
Source: Bureau of Labor Statistics
Information is subject to change and is not a guarantee of future results.
Chart 2, 1:17– This chart shows the monthly change in nonfarm payrolls. It's not as exciting. The columns are the monthly change. Due to the volatility of the monthly data, the dark blue line is the average of the past six months, which smooths the data and makes trends easier to notice. In 2023 and 2024, the economy averaged monthly growth above the approximately 150,000 new hires it recorded in the year before the pandemic.
This year, hiring has slowed markedly. The trend had moved down to less than half that level, to just 59,000 per month average.
The hiring of workers is a confidence issue. Employers will increase their hiring when they are confident about the economic outlook. That appears to be the issue right now. The tempered labor demand is attributed to high levels of economic uncertainty stemming from the trade war, layoffs of federal workers, a shortage of available workers in certain professions, such as construction, agriculture and healthcare and uncertainty surrounding artificial intelligence.
BLS & ADP: Private Nonfarm Payroll
'000, monthly change, seasonally adjusted
Data current as of November 20, 2025.
Source: Bureau of Labor Statistics
Information is subject to change and is not a guarantee of future results.
Chart 3, 2:27– Now, we will look at how the government data compares with private-sector views. Here, we are looking at the government data from the Bureau of Labor Statistics. The blue columns represent the monthly change in private sector payrolls. So it's not counting the government jobs.
The bright-blue columns are the data from ADP of private sector jobs. So, who is ADP? It stands for automatic data processing. They are the largest payroll provider in the United States. The report is based on payroll transaction data for more than 25 million workers across more than 500,000 employers. It represents about 1 in 5 private-sector workers. They do not service government workers. That is why we're looking at just private payroll data.
The report was launched in 2006 with great fanfare as an early indicator for the BLS monthly labor report will show. But, the report didn't correlate well with the BLS report, so the market didn't pay much attention to it.
In 2022, ADP announced that it had retooled the report in partnership with the Stanford Digital Economy Lab. The revamped report generally aligns with the BLS report. Since it's issued a few days before the BLS report, it is used by forecasters to help make their forecasts of the BLS report, which is issued on the Friday of that week.
The results can vary from month-to-month due to differences in the underlying data and methodology, but the trend is what is important.
The lines in this chart are showing the respective six-month moving average. The ADP data in light blue has generally been a leading indicator of the government data releasing by the BLS. This shows that the trend has been cooling. The good news is that last month it showed a little tapering in the downward trend. Hopefully that will continue.
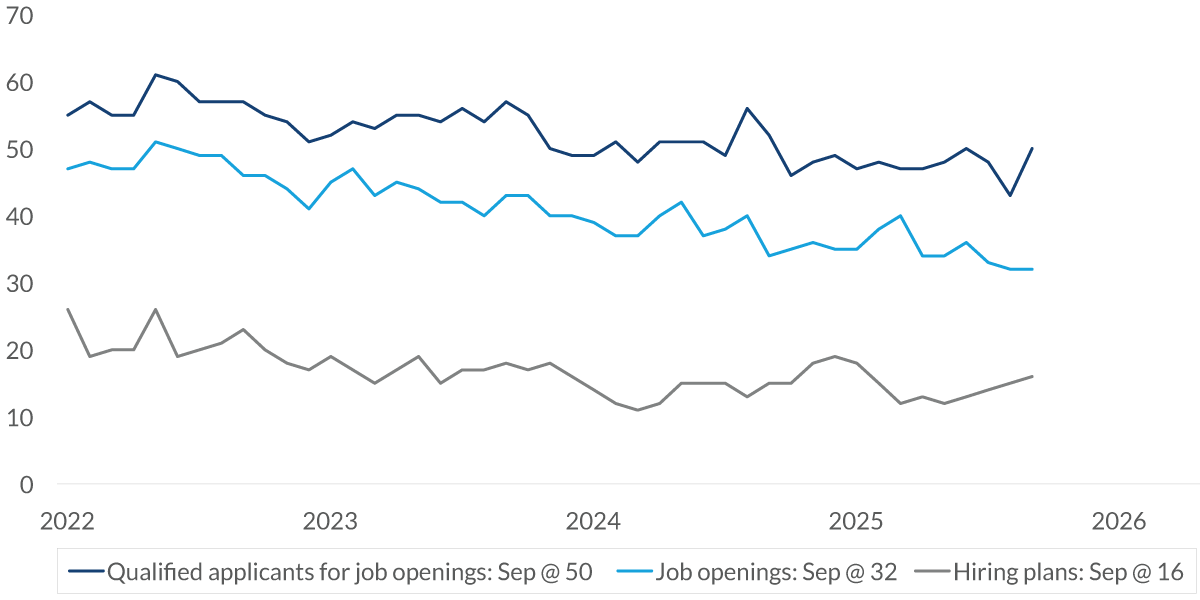
NFIB: Employment
%, not seasonally adjusted
Data current as of November 20, 2025.
Source: National Federation of Independent Business
Information is subject to change and is not a guarantee of future results.
Chart 4, 4:25– Another source of forecasting labor demand comes from small businesses. In this case, the National Federation of Independent Business has a lot of great information. Regarding labor demand, you can see from this chart that the outlook hasn’t changed much over the past few years, which is a good sign. It is just a very gradual slowing, which is natural as the economy matures, but is not falling off a cliff. Looking at the dark blue line at the top, employers are finding qualified applicants for job openings. The bright blue line in the middle is the number of job openings and the dark gray at the bottom is hiring plans. All of this shows stability in labor demand by small businesses.
Job Opening by Company Size
millions, seasonally adjusted, August 2025
Data current as of November 20, 2025.
Source: Bureau of Labor Statistics
Information is subject to change and is not a guarantee of future results.
Chart 5, 5:08– This is essential data. Small businesses do most of the hiring in this country. This chart shows the number of job openings by company size. Yes, large corporations make the news with layoffs, but most hiring is happening in smaller companies. We define small businesses as those with fewer than 250 workers. That accounts for 87% of all job openings.
This video focused on private-sector data on the labor market. It has been shown that demand for labor continued to grind lower as employers remain concerned about what the future may look like. But the general theme is that there has been some lay offs, but that's been relatively mild compared to the 160 million workers that we have in the United States at this point. With the regular release of economic data in the coming weeks, the Fed will have the information it needs to direct monetary policy. That should help lower some of the anxiety that many firms have regarding future hiring. But at this stage, the labor market remains strong and should strengthen when that uncertainty subsides.
Important Information
The views expressed represent the opinions of RBC Rochdale, LLC which are subject to change and are not intended as a forecast or guarantee of future results. Stated information is provided for informational purposes only, and should not be perceived as personalized investment, financial, legal or tax advice or a recommendation for any security. It is derived from proprietary and non-proprietary sources which have not been independently verified for accuracy or completeness. While Rochdale believes the information to be accurate and reliable, we do not claim or have responsibility for its completeness, accuracy, or reliability. Statements of future expectations, estimates, projections, and other forward-looking statements are based on available information and management's view as of the time of these statements. Accordingly, such statements are inherently speculative as they are based-on assumptions which may involve known and unknown risks and uncertainties. Actual results, performance or events may differ materially from those expressed or implied in such statements.
All investment strategies have the potential for profit or loss; changes in investment strategies, contributions or withdrawals may materially alter the performance and results of a portfolio. Different types of investments involve varying degrees of risk, and there can be no assurance that any specific investment will be suitable or profitable for a client's investment portfolio.
© 2025 City National Bank. All rights reserved.
