
-
Economic Perspectives
Labor: Objects in the Mirror are Smaller than they Appear
September 2025
- Filename
- Economic Perspectives SEPTEMBER 2025.pdf
- Format
- application/pdf

TRANSCRIPT
Labor data that has been released over the past few months have shown that the demand for workers is much weaker than previously thought. It started in early August when the July labor report was released, showing a gain of 73,000, below the expectation of 104,000. More importantly, the two previous months were revised down by a staggering 258,000.
The president quickly terminated the head of the Bureau of Labor Statistics and has recommended a replacement, who will need to be confirmed by the Senate. Then, in early September, the BLS released the results of their annual benchmark revision, which showed an estimate of 911,000 fewer workers than previously thought, for the 12 months ending in March 2025. That is the largest revision on record.
This month, we will look into some of the issues that are causing the drop in worker demand, the reasons why revisions are getting larger and how the Fed is responding to the slower pace of payroll growth.
Let’s look at some charts.
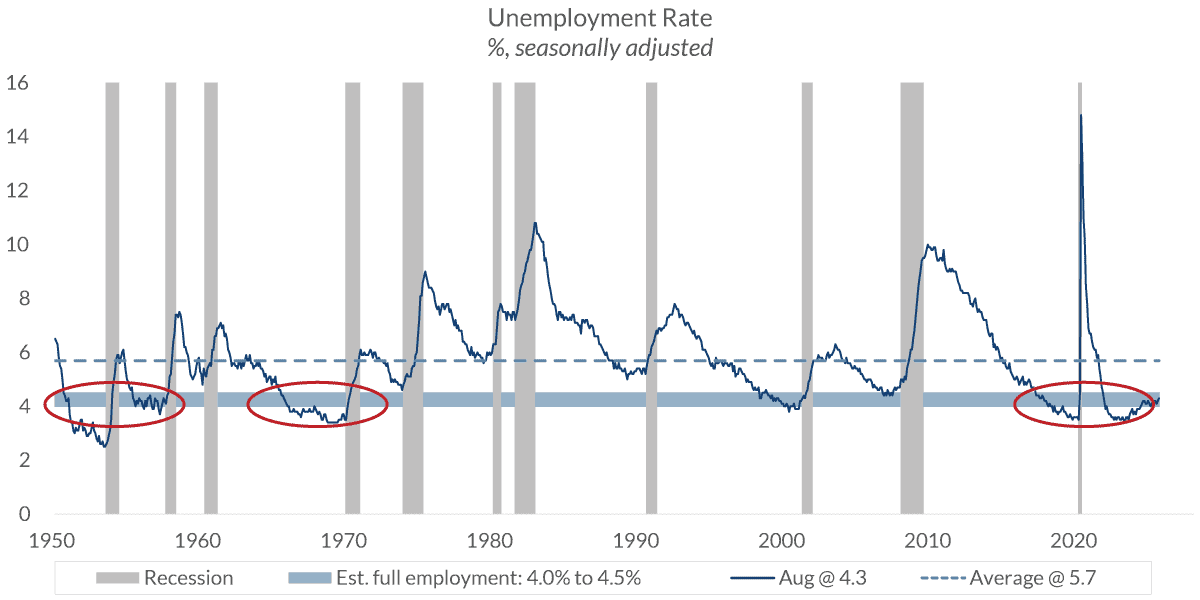
Unemployment Rate
%, seasonally adjusted
Data current as of September 23, 2025
Source: Bureau of Labor Statistics
Information is subject to change and is not a guarantee of future results.
Chart 1, 1:27– Here we are looking at the unemployment rate. It is currently standing at just 4.3%. In this chart, which goes back to 1950, it shows a light blue horizontal band, which represents the range of 4% to 4.5% unemployment. A level that many economists view as full employment. It is rare for the unemployment rate to be within the band or below it for a sustained period of time.
It did so in the early 1950s and late 1960s, when the country was at war, in Korea and Vietnam. There was a draft and a lot of young men were in the military, not looking for a job. That was a technical issue that drove down the unemployment rate. This time, on the right side, the rate is low in part due to baby boomers retiring faster than the younger generations. But it is mostly due to the strength of the economy.
Now this report gives us the relationship between those who are working and those who would like to be working. So, the unemployment rate is not a problem for the Fed.
NFP: Change in Nonfarm Payrolls
'000, seasonally adjusted
Data current as of September 23, 2025
Source: Bureau of Labor Statistics
Information is subject to change and is not a guarantee of future results.
Chart 2, 2:35– But in a separate survey, the monthly change in nonfarm payrolls, it is showing near stagnant growth. The columns in this chart show the monthly change, which tends to be volatile. The dark blue line is the three-month moving average, which smooths out the data. It is quite clear; there is a slowdown in hiring. In the past three months, payroll growth has averaged just 29,000 per month. That is a significant decline from the beginning, when there was a very positive view based on the new pro-growth administration.
Back then, the monthly average was 232,000. It is well below the estimated 100,000 gain that is needed to keep the unemployment rate stable. This is why the Fed is concerned.
The Fed has a dual mandate. It is a Congressional statutory directive for them to pursue two primary goals of maximum employment and stable prices. Since 2022, when the consumer price index jumped to 9.1%, the Fed has been primarily focused on inflation, keeping monetary policy restrictive, trying to bring inflation down to its target rate of 2%.
Although inflation is still above the Fed’s target, the Fed has grown concerned with the weakening demand for workers.
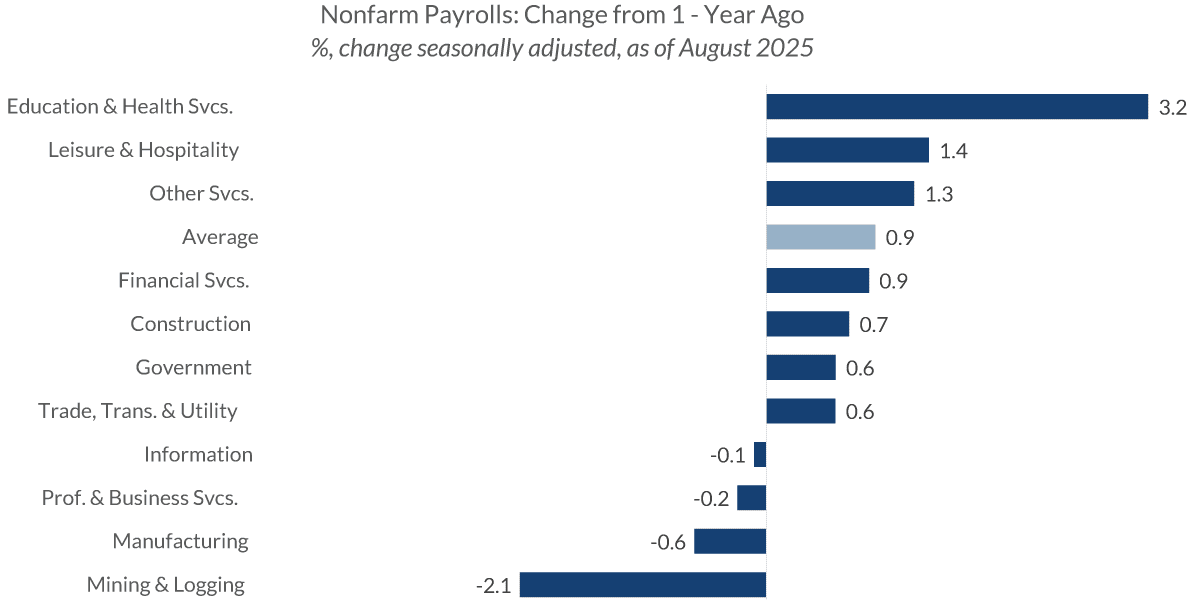
Nonfarm Payrolls: Change from 1-Year Ago
%, change seasonally adjusted, as of August 2025
Data current as of September 23, 2025
Source: Bureau of Labor Statistics
Information is subject to change and is not a guarantee of future results.
Chart 3, 4:01– Another reason for the Fed to be concerned is the types of jobs that are being filled. This chart shows the percentage change over the past year in the number of workers in the 11 major categories the BLS monitors. At the top are the biggest increases: education and health care along with leisure and hospitality. Both of those are considered noncyclical jobs. There is constant hiring in these professions.
An economy looking to expand at a faster pace would have job growth in cyclical jobs, like manufacturing, professional and business services, and information technology. So that is where labor stands now.
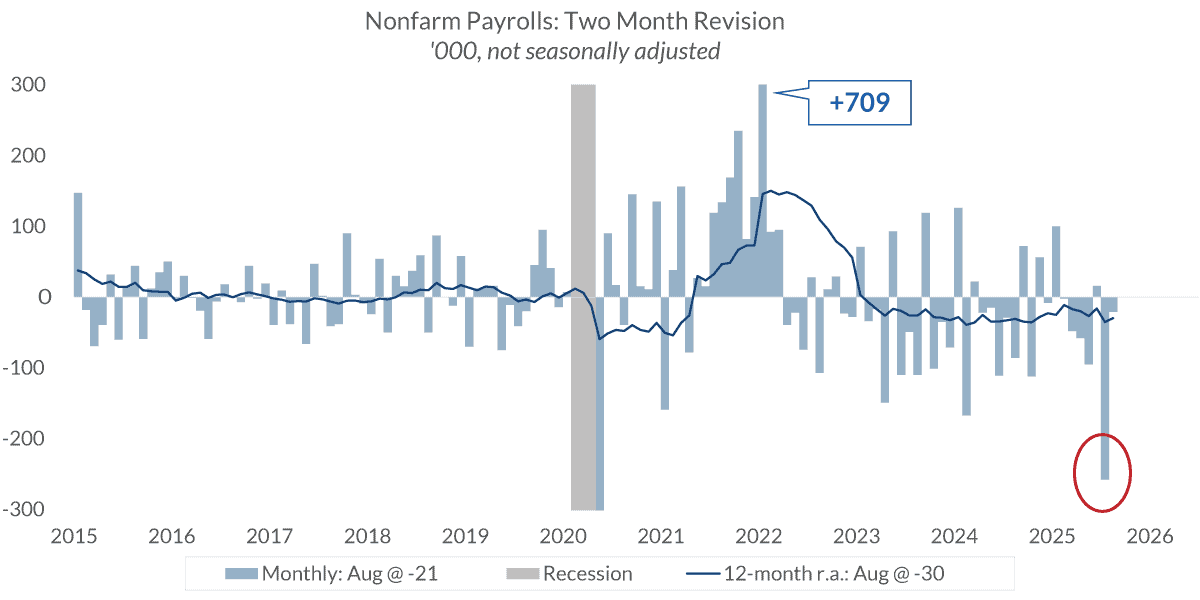
Nonfarm Payrolls: Two Month Revision
'000, not seasonally adjusted
Data current as of September 23, 2025
Source: Bureau of Labor Statistics
Information is subject to change and is not a guarantee of future results.
Chart 4, 4:48– Regarding the revision of the data, you can see in the chart, which measures the revision of the two previous months. Clearly, the revisions have been larger in the past few years compared to pre-pandemic times. The July revision clearly sticks out like a sore thumb, down 258,000, much more than the 12-month average of -30,000, which includes that monthly move.
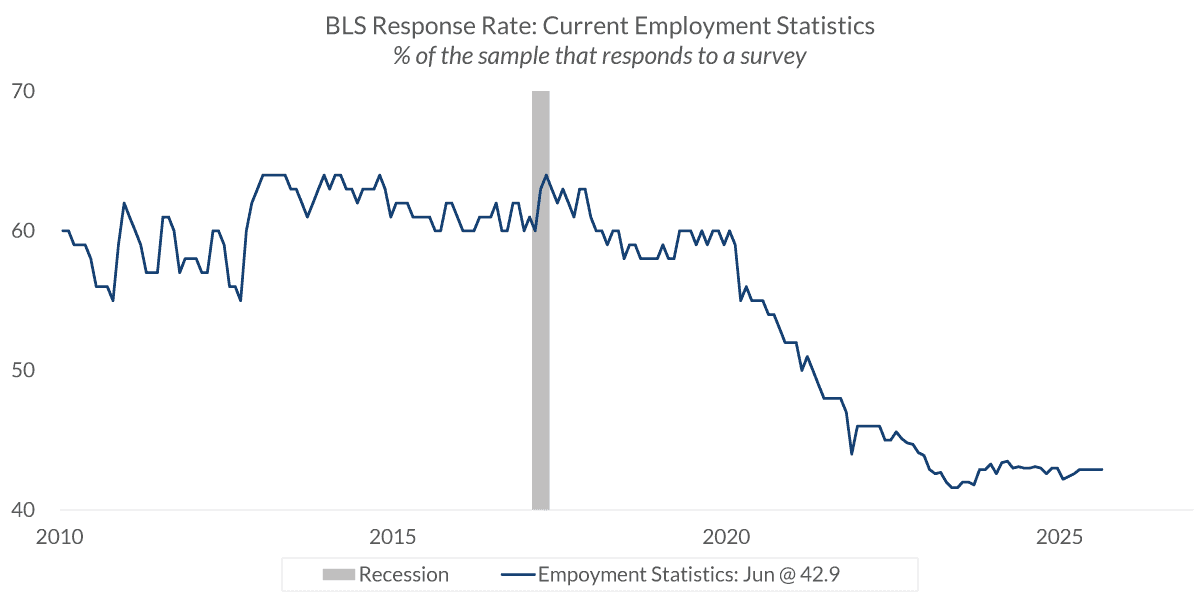
BLS Response Rate: Current Employment Statistics
% of the sample that responds to a survey
Data current as of September 23, 2025
Source: Bureau of Labor Statistics
Information is subject to change and is not a guarantee of future results.
Chart 5, 5:14– The major reason for the larger revisions is the poor response to the survey. This chart shows the response rate hovering around 40%. That is about one-third less than the rate was before the pandemic. Without that data, the BLS has to make estimates. And, it is also due to the responses being returned a month or two late, so that has to be adjusted for. Or the response gets revised; that, too, will cause an adjustment in the data.
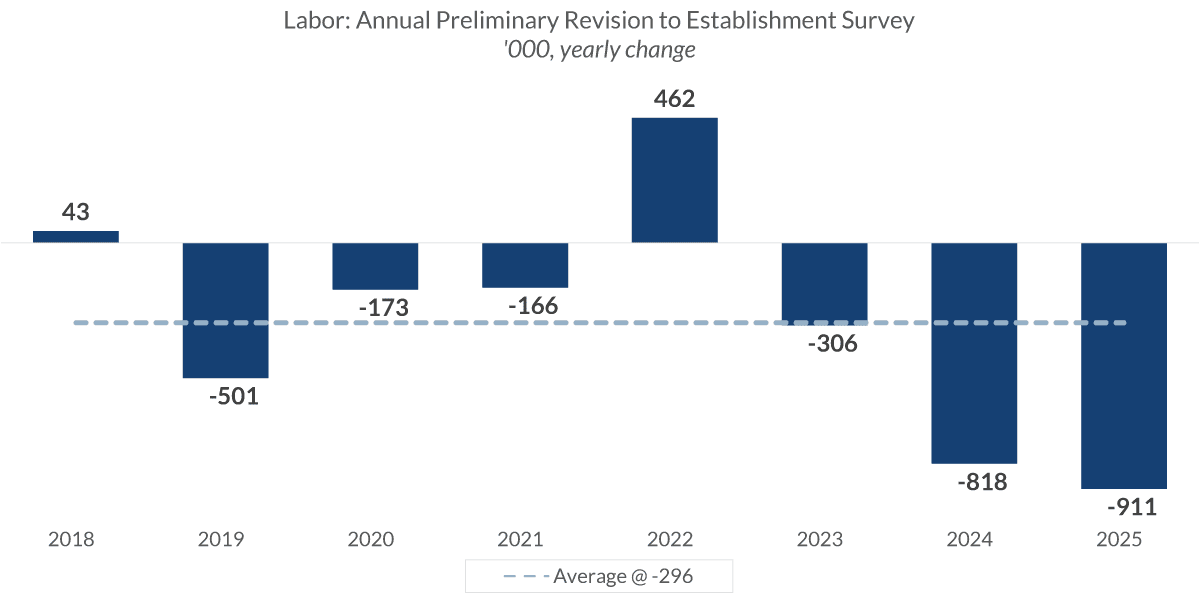
Labor: Annual Preliminary Revision to Establishment Survey
'000, yearly change
Data current as of September 23, 2025
Source: Bureau of Labor Statistics
Information is subject to change and is not a guarantee of future results.
Chart 6, 5:50– This chart shows the annual revision to the data. You can see that the last two years have been more extreme than the previous years.
Let me take a moment to explain how this works. The monthly labor report is not a census, which would be an actual count of all workers. It is a survey. The BLS gets some actual hard data on workers from businesses and government agencies; the rest is based upon estimates.
The BLS surveys over 600,000 business entities asking how many workers they have. That accounts for about 40 million workers, which is about a quarter of the approximately 160 million workers in the nonfarm payroll report. The other 120 million comes from statistical models they have. So, there are a lot of assumptions that are made.
For context, the national polls that we hear about, like Gallup, their survey sample is 1 to 5,000. So, by comparison, the labor report from the BLS is enormous. Once a year, the BLS will calibrate its data with tax records, specifically the money paid into unemployment insurance. That data accounts for about 95% of all workers.
In late August/early September the BLS releases their preliminary estimate of the annual adjustment. The major portion of the revision is usually due to something called the birth/death adjustment. Birth refers to new businesses and death refers to companies going out of business.
This is a difficult and large cohort to estimate. The BLS cannot send a survey request to a company they don’t know exists. They have to wait for the analysis of the tax records to know they exist. Also, they don’t know when a business closes. They know that no survey was returned, but was that because the business is closed or they just didn’t get around to responding?
So, the BLS makes assumptions, based on recent history, of the number of businesses that are starting and businesses that have closed. The hard part is that it is not a constant. As the economy moves through the economic cycle, those numbers will vary greatly. That is the major cause of the large variances. Considering how chaotic the economy has been in the post-pandemic world, it is not a surprise that there have been large adjustments made to the birth/death adjustment.
What does this all mean for the Fed?
Well, as mentioned, they have become more focused on labor. Thus, they have taken a more dovish stance. They cut the federal funds rate by 25 basis points at their recent meeting in mid-September. They plan on two more cuts this year. That will bring the median rate down to 3.625, 25 basis points lower than they thought back in June. They plan on another cut of 25 bps in 2026 and in 2027, bringing the rate to 3.125%, which is viewed as neutral policy.
Clearly, this move to focus on the labor market will delay the Fed on bringing inflation to target, but it is bullish news for the economy.
Important Information
The views expressed represent the opinions of RBC Rochdale, LLC which are subject to change and are not intended as a forecast or guarantee of future results. Stated information is provided for informational purposes only, and should not be perceived as personalized investment, financial, legal or tax advice or a recommendation for any security. It is derived from proprietary and non-proprietary sources which have not been independently verified for accuracy or completeness. While Rochdale believes the information to be accurate and reliable, we do not claim or have responsibility for its completeness, accuracy, or reliability. Statements of future expectations, estimates, projections, and other forward-looking statements are based on available information and management's view as of the time of these statements. Accordingly, such statements are inherently speculative as they are based-on assumptions which may involve known and unknown risks and uncertainties. Actual results, performance or events may differ materially from those expressed or implied in such statements.
All investment strategies have the potential for profit or loss; changes in investment strategies, contributions or withdrawals may materially alter the performance and results of a portfolio. Different types of investments involve varying degrees of risk, and there can be no assurance that any specific investment will be suitable or profitable for a client's investment portfolio.
© 2025 City National Bank. All rights reserved.
Put our insights to work for you.
If you have a client with more than $1 million in investable assets and want to find out about the benefits of our intelligently personalized portfolio management, speak with an investment consultant near you today.
If you’re a high-net-worth client who's interested in adding an experienced investment manager to your financial team, learn more about working with us here.
