Quarterly Update: Q1 2026


This month, our view is being tested that a long-term closure of the Strait of Hormuz remains unlikely. While the ceasefire has held between Iran and the U.S., the free flow of energy remains in question, and it’s raising our concern that underlying risks are building beneath the surface of the equity rally.
When markets start to diverge, the forward outlook gets murkier. Energy prices have moved higher, reflecting real constraints and uncertainty on the ground. But equity markets have also continued to push higher, signaling confidence that this disruption will be temporary and ultimately resolved.
A gap in pricing like this is rare, and it tells us that the market is looking past current conditions and pricing in a relatively quick normalization once the strait is opened. But it’s clear to us that even if ships begin freely passing, there is a rebuilding effort that needs to take place to get back to full capacity. We would caution against the most pessimistic views on the timelines for a restart, but it remains a reality with very low visibility.
Iran’s continued resistance around movement through the strait has forced the U.S. to step in with ‘Project Freedom,’ aimed at guiding and protecting shipping flows. While that’s a positive signal for maintaining energy supply, it also raises important questions. The execution remains unclear, and greater U.S. involvement could either accelerate a resolution—or increase the risk of further escalation before a deal is reached.
Ultimately, the key question is whether shippers are willing to move cargo through the strait. With insurers largely pulling back, that decision remains challenging, even with a U.S. escort in place.
So, we are back to where we started. The longer this divergence persists, between rising real-world costs and optimistic market expectations, the more fragile the market becomes. And that’s why, despite the market’s rise from the lows, we’re increasingly focused on the risks building beneath the surface.
But, even with these risks in place, the market is doing its best Jedi mind trick in attempting to make the situation disappear. Markets have delivered a powerful rebound since the March 30 lows. The S&P 500 is up roughly 14%, with technology shares staging a near 22% rally. Over the full year, small-cap shares have also been brilliant, shooting up 14% vs. the broad market’s 6% advance. Developed international and emerging are up 8% and 13% from the lows, while China has been the laggard. It remains squarely in an energy supply time crunch given its reliance on the Persian Gulf for its energy needs. Yes, it has reserves, but it will increasingly face pressure in a much more visceral way than other parts of the world. What stands out to us in this environment is not just the magnitude but the participation across size, style and region. So, the returns look great, but what about the U.S. economy? While the data continues to support market momentum, it is coming into balance.
Growth is still positive, but, given the risks from the war, it is skewed to the downside. On Inflation, we haven’t yet seen the impact from energy prices on the core numbers, but it will start to soak in. The difference relative to 2022 is that we know where the shock is coming from, but that only goes so far if the economic damage becomes longer lasting. Manufacturing is showing signs of a “stealth recovery,” driven by AI, semiconductors and capital investment. The latest GDP print shows that investment rose heavily over the quarter, despite a lot of the uncertainty companies are facing. Consumer spending is still solid. Real personal spending rose over April, and income growth remains positive.
Overall, the data signals that the environment is stable, and this should continue to support the earnings picture, which is a major factor for higher equity prices. Full-year earnings expectations are now approaching 20%. Every single sector so far this season is positive, with 70% of companies beating expectations.
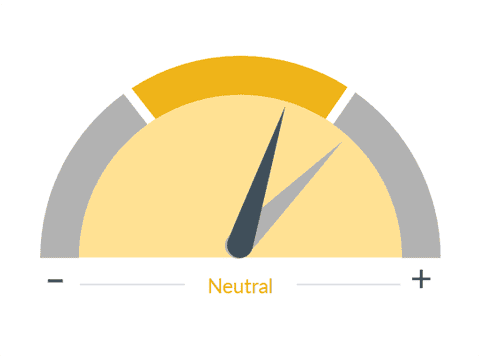
That brings us to this month’s Speedometer changes.
As a quick reminder, these indicators are designed to capture what matters most for forward equity returns over the next six to nine months.
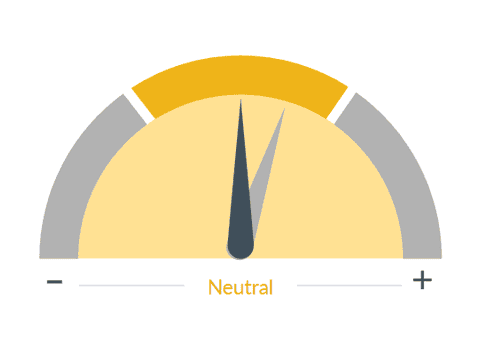
■ Previous Month ■ Current Month
Monetary Policy
What we see
Monetary policy is one of two ways the government can influence the economy and financial markets. By manipulating interest rates, the Federal Reserve can raise or lower the cost of money to stabilize or stimulate the economy. For example, if the cost of credit is reduced, more people and firms will borrow money and the economy will grow. Higher interest rates will increase the cost of its debt, reducing borrowing and company profits, and may slow economic growth.
Dial 1: Monetary Policy, 4:04— First, the downgrades. The Monetary Policy outlook is less supportive. Rate cuts are being pushed out, and while policy is not restrictive enough to break the economy, it’s also not providing the tailwind markets had expected earlier this year. This will be important to watch as Kevin Warsh enters the picture and Jerome Powell stays on, but the Fed is starting to move further away from a rate cut bias.

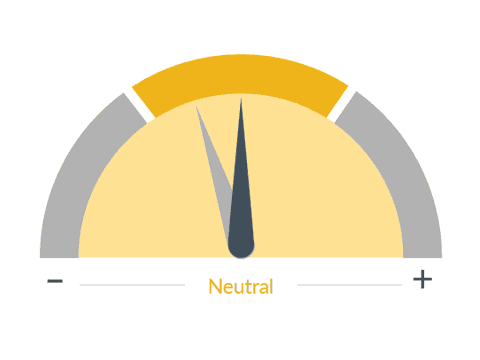
■ Previous Month ■ Current Month
US Economic Outlook
What we see
RBC Rochdale's investment and portfolio strategy is driven by our macroeconomic analysis. Timely economic forecasting is very difficult to do but extremely important, especially as the significance of economic information to financial markets continues to rise. To form a reliable outlook for the economy, RBC Rochdale utilizes a comprehensive internal research effort that is complemented by an extensive set of external research from some of Wall Street's leading strategists.
Dial 2: US Economic Outlook, 4:24— U.S. Economic Growth also has less potential. Growth remains positive, but the trajectory is slowing. Higher energy prices and lingering uncertainty are beginning to weigh on the outlook. We expect growth to come in closer to our 2% lower-end estimate as the impact from the Iran war filters through.
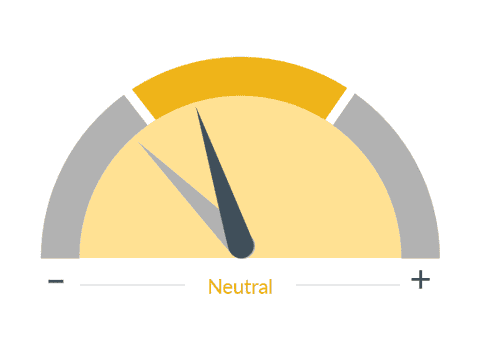
■ Previous Month ■ Current Month
Disposable Personal Income
What we see
The amount of money households have available for spending and saving after income taxes. A change in a household's real income is by far the most important factor in determining how much that household will spend. Other factors, such as home values or financial savings, matter as well but to a significantly lesser extent.
Dial 3: Disposable Personal Income, 4:42— Disposable Personal Income is stabilizing. This reflects pressure from inflation and slower wage growth, particularly for lower-income consumers. Wages are still growing faster than long-term averages, but they are slowing down.
■ Previous Month ■ Current Month
Consumer Sentiment
What we see
How consumers feel about their overall financial health as well as that of the economy on the short and long term. This is an important indicator, as the consumer is the largest driver of the U.S. economy.
Dial 4: Consumer Sentiment, 4:58— But we also had two important upgrades: Consumer Sentiment continues to be noisy, but it can’t go much lower. We expect the outlook to improve if geopolitical risks stabilize.
■ Previous Month ■ Current Month
Equity Market Valuation
What we see
Questions of value are always subjective and relative. We believe that equity market valuation should be measured against both the value of stocks at their historical levels and the other investment options available. A stock is worth its future earnings, but that involves a degree of uncertainty, which affects its price depending on the degree.
Dial 5: Equity Market Valuation, 5:06— And Equity Valuation did improve modestly. After the pullback earlier this year, valuations became more attractive, and while still elevated, they are less of a headwind than they were just a few months ago.
So where does that leave us?
Markets are doing what they often do by looking through uncertainty and pricing in a better future outcome. But the underlying drivers of that future—growth, policy, energy costs and the geopolitical situation—are not aligned, suggesting a less-certain outcome. That forces us to base our views on strong earnings, supportive liquidity and still-positive growth.
Sticking with the market at the depths of the March pullback was the right call. But, from here, forward returns are likely to be capped with much less room to run until resolution is reached in the Middle East. We’re actively factoring that into our portfolio recommendations, and we’re poised to make a shift if the environment doesn’t meaningfully change over the coming months.
RBC Rochdale, LLC is an SEC-registered investment adviser and wholly-owned subsidiary of City National Bank. Registration as an investment adviser does not imply any level of skill or expertise. City National Bank is a subsidiary of the Royal Bank of Canada.
The information presented does not involve the rendering of personalized investment, financial, legal or tax advice. This presentation is not an offer to buy or sell, or a solicitation of any offer to buy or sell any of the securities mentioned herein.
Certain statements contained herein may constitute projections, forecasts and other forward-looking statements, which do not reflect actual results and are based primarily upon a hypothetical set of assumptions applied to certain historical financial information. Certain information has been provided by third-party sources and, although believed to be reliable, it has not been independently verified and its accuracy or completeness cannot be guaranteed.
Any opinions, projections, forecasts, and forward-looking statements presented herein are valid as of the date of this document and are subject to change.
Rochdale Speedometers are indicators that reflect forecasts of a 6-to-9-month time horizon. The colors of each indicator, as well as the direction of the arrows represent our positive/negative/neutral view for each indicator. Thus, arrows directed towards the (+) sign represents a positive view which in turn makes it green. Arrows directed towards the (-) sign represents a negative view which in turn makes it red. Arrows that land in the middle of the indicator, in line with the (0), represents a neutral view which in turn makes it yellow. All of these indicators combined affect RBC Rochdale’s overall outlook of the economy.
RBC Rochdale, LLC., its managed affiliates and subsidiaries, as a matter of policy, do not give tax, accounting, regulatory, or legal advice, and any information provided should not be construed as such.
All investing is subject to risk, including the possible loss of the money you invest. As with any investment strategy, there is no guarantee that investment objectives will be met and investors may lose money. Diversification does not ensure a profit or protect against a loss in a declining market. Past performance is no guarantee of future results.
©2026 RBC Rochdale, LLC. All rights reserved.