
-
Economic Perspectives
When Will the Fed Start Cutting Interest Rates?
February 2024
- Filename
- Economic Perspectives FEBRUARY 2024.pdf
- Format
- application/pdf

TRANSCRIPT
Since late November, the financial markets have had a very aggressive approach toward the Fed’s adjustment of monetary policy. It was based on the belief that inflation would continue to fall toward the Fed’s goal of 2%. At the same time, we at City National Rochdale were not as aggressive. We believed that the “last mile” of disinflation would take a lot longer than the market thought, and it would probably be a bumpy ride. What we’ve seen since then is that the Federal funds futures market has been on a roller coaster ride, not the merry go round that many had hoped for.
Number of 25 bp Hikes (+) or Cuts (-)
at Upcoming FOMC Meetings
implied based upon federal funds futures market from the present level of 5.375%,
as of February 21, 2024
Data current as of February 21, 2024
Sources: Bloomberg WIRP page
Information is subject to change and is not a guarantee of future results.
Chart 1: 0:50– This first chart shows the implied number of cuts and the Federal funds rate for this year for the December Federal funds futures contract. The light blue vertical lines that you see are when the FOMC has met.
The middle vertical line was the meeting in December — that’s when the Fed started to turn dovish. They chose not to raise the federal funds rate by 25 basis points (bps), like they had projected back in September, and they hinted that rate hikes are likely over, and, at the same time, they signaled three rate cuts of 25 bps for this year.
The market quickly shifted its view to expecting six cuts of 25 bps this year, from the four and a half that they thought just the day before. The market got close to seven cuts of 25 bps back in January.
Number of 25 bp Hikes (+) or Cuts (-)
at Upcoming FOMC Meetings
implied based upon federal funds futures market from the present level of 5.375%,
as of February 21, 2024
Data current as of February 21, 2024
Sources: Bloomberg WIRP page
Information is subject to change and is not a guarantee of future results.
Chart 1 (cont.): 1:47– The bright blue line shows the implied cuts of the March contract. In early January, there was the expectation that the Fed would make its first cut at the March meeting. When you look at the right side of the chart, you can see it has changed. The aggressive view has waned, and the market is no longer expecting a cut in March, and the December contract now implies just three and a half cuts this year, less than what it was right before the December meeting.
So what has caused this severe change in the market’s outlook? Well, it’s inflation. The headline data is telling one story while the underlying components tell a different one.
Core Personal Consumption Expenditure Price Index
% change, seasonally adjusted
Data current as of February 21, 2024
Source: Bureau of Economic Analysis
Information is subject to change and is not a guarantee of future results.
Chart 2: 2:28– Here we are looking at the Core PCE price index. This is the Fed’s preferred inflation measurement, mainly because it follows the spending habits of American shoppers, and this is where the headline data is exciting. The columns on this page are the yearly change. They have retreated significantly from the high of 5.6% to the current level of 2.9%. What’s more exciting is that the recent trend, the three-month and the six-month annualized rates, are below 2%.
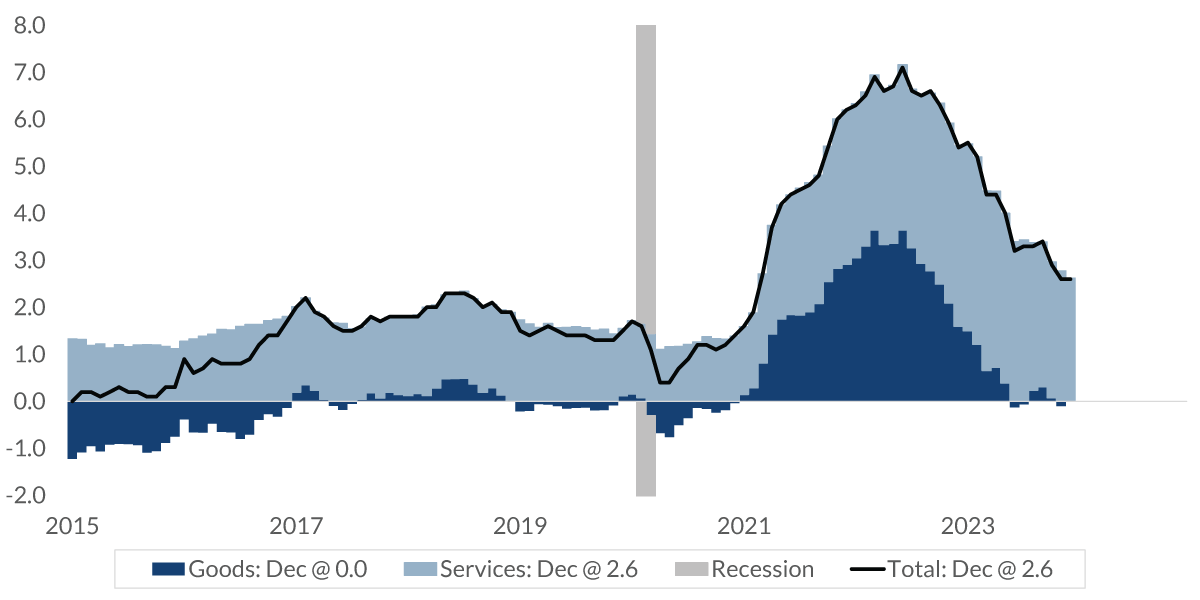
Core-PCE Price Index: Contribution
% change, y-o-y, seasonally adjusted
Data current as of February 21, 2024
Source: Bureau of Economic Analysis
Information is subject to change and is not a guarantee of future results.
Chart 3: 2:59– But when looking at the two major components, goods and services, we can see that services, here in light blue, contribute 100% to the inflation reading. Service inflation is much stickier than goods inflation.
The goods inflation, which is in dark blue, was strong in 2021, ’22, and early 2023 as the economy dealt with pandemic-caused shortages, strong demand, and transportation snarls.
Those issues have by and large been resolved, and goods inflation is hovering around 0% year over year, much like it was before the pandemic. But the service prices, as I mentioned, are much stickier, and they have yet to return to their pre-pandemic levels.
PCE: Housing
% change, seasonally adjusted
Data current as of February 21, 2024
Source: Bureau of Economic Analysis
Information is subject to change and is not a guarantee of future results.
Chart 4: 3:44– There are two significant components within the service prices. First is housing. The columns are at an annual change, which currently sits at 6.4%, almost twice what it was for the average of the five years before the pandemic. Although the yearly rate has declined, the stickler here is the three- and six-month annualized rates, which have stabilized around 5.7%, so there probably won’t be much downward movement in the annual rate over the next few months.
PCE: Core Services, Less Shelter (SuperCore)
% change, not seasonally adjusted
Data current as of February 21, 2024
Source: Bureau of Economic Analysis
Information is subject to change and is not a guarantee of future results.
Chart 5: 4:14– The other part of service inflation is called SuperCore. Last autumn, the Fed singled out this measurement as the best way to monitor the inflationary impact of services that tend to have a lot of labor costs — things like health care, transportation, recreation. Because of its importance to the Fed, we’re looking at this data in greater detail. The columns are the monthly data and the lines are the three-month annualized and yearly data.
You can see from the monthly data that this has been volatile of late, but the three-month annualized in the light blue line hasn’t budged much since last summer. The high readings on housing and SuperCore reports make it difficult for the Fed to be comfortable in believing that inflation is on its way to a sustainable 2% rate — now, the markets are believing it.
Federal Funds Rate: Expectations (%)
Data current as of February 21, 2024
Sources: Federal Reserve, Bloomberg WIRP page, CNR Research
Information is subject to change and is not a guarantee of future results.
Chart 6: 5:02– The bright blue line on the left-hand side shows the current level of the Federal funds rate being 5.375%. The lighter blue columns are the implied Federal funds rate based on the futures market. The dark gray line represents the Fed’s plan for three cuts this year, and the dark blue area is CNR’s expectation for two or three cuts.
You will notice that the futures market now expects the first cut to take place in June — that’s three months later than what they thought just a few months ago.
Now, forecasting the Federal funds rate accurately is very, very difficult. There are so many variables that are out there that can impact the economy in terms of its pace of growth, and also inflation. Although the U.S. economy is robust, the global economy is not. The United Kingdom is in a technical recession, and that’s also true about Germany and Japan. In fact, all of Europe’s GDP has grown just one-tenth of a percent in the past year. China is dealing with several economic problems.
Now, will all of this help speed up global disinflation and help out the Fed? What about here in the United States? We’re seeing a rapid increase in productivity, and will that help lower inflation? These are all factors that the Fed is thinking about as they try to assess inflationary risks.
In the end, this is a judgment call for the Fed. They need to decide when they’re comfortable that inflation will move down and be sustainable at 2%.
As for our view, since December, we have stated that we expect the Fed to begin lowering interest rates in the second half of 2024. Technically, that would mean starting in July, but if they made their first cut in June, as the financial markets expect, that wouldn’t be a big deal compared to what our outlook is. The critical and most important issue here is the fact that the Fed is signaling that they’re comfortable — that inflation will move down as they hope.
Important Information
The views expressed represent the opinions of City National Rochdale, LLC (CNR) which are subject to change and are not intended as a forecast or guarantee of future results. Stated information is provided for informational purposes only, and should not be perceived as personalized investment, financial, legal or tax advice or a recommendation for any security. It is derived from proprietary and non-proprietary sources which have not been independently verified for accuracy or completeness. While CNR believes the information to be accurate and reliable, we do not claim or have responsibility for its completeness, accuracy, or reliability. Statements of future expectations, estimates, projections, and other forward-looking statements are based on available information and management's view as of the time of these statements. Accordingly, such statements are inherently speculative as they are based on assumptions which may involve known and unknown risks and uncertainties. Actual results, performance or events may differ materially from those expressed or implied in such statements. All investing is subject to risk, including the possible loss of the money you invest. As with any investment strategy, there is no guarantee that investment objectives will be met, and investors may lose money. Diversification does not ensure a profit or protect against a loss in a declining market. Past performance is no guarantee of future performance.
All investing is subject to risk, including the possible loss of the money you invest. As with any investment strategy, there is no guarantee that investment objectives will be met, and investors may lose money. Diversification does not ensure a profit or protect against a loss in a declining market. Past performance is no guarantee of future performance.
City National Rochdale, LLC, is a SEC-registered investment adviser and wholly owned subsidiary of City National Bank. Registration as an investment adviser does not imply any level of skill or expertise. City National Bank and City National Rochdale are subsidiaries of Royal Bank of Canada. City National Bank provides investment management services through its subadvisoryrelationship with City National Rochdale, LLC. City National Bank and City National Rochdale are subsidiaries of Royal Bank of Canada.
© 2024 City National Bank. All rights reserved.
CITY NATIONAL ROCHDALE, LLC NON-DEPOSIT INVESTMENT PRODUCTS ARE: • NOT FDIC INSURED •NOT BANK GUARANTEED •MAY LOSE VALUE


Put our insights to work for you.
If you have a client with more than $1 million in investable assets and want to find out about the benefits of our intelligently personalized portfolio management, speak with an investment consultant near you today.
If you’re a high-net-worth client who's interested in adding an experienced investment manager to your financial team, learn more about working with us here.
