
-
Market Perspectives
May the Stocks Be With You
May 2026
- Filename
- Market Perspectives May 2026.pdf
- Format
- application/pdf
.jpg "Charles Boettcher, CPWA®")
TRANSCRIPT
Wow. What a rebound over the past month. The second quarter is off to a torrid start; it’s not just the flowers blooming.
QTD, the S&P 500 is up over 13%, YTD is around 8%, and the rolling 1-year return is a bit above 35%. Wow.
This month I’ll provide a quick update, then focus on one of the driving forces behind the market’s strong push, and then take a look forward.
QUICK UPDATE
- Iran remains the dominant macro swing factor. A deal that could reopen the Strait of Hormuz is proving elusive, oil fell below $100 on hopes of de-escalation, but recent news has pushed it back above.
- The growth backdrop is holding up better than the headlines suggest.
- The concern is not activity collapsing—it is cost pressure building.
- U.S. services are still expanding, but with softer demand underneath.
- Business investment remains a bright spot.
- Jobs data indicate stabilization, not acceleration.
Against this backdrop, U.S. equities remain resilient despite geopolitical uncertainty, with many of the major indices reaching new highs. In addition to the aforementioned gains in the S&P 500, the NASDAQ is now up nearly 25% since March 30, while semiconductors have surged more than 43% off the lows.
Small caps continue to recover sharply from the March lows. The Russell 2000 is up nearly 19% since March 30, reflecting improving confidence in domestic economic activity.
Q1-2026 Earnings Summary
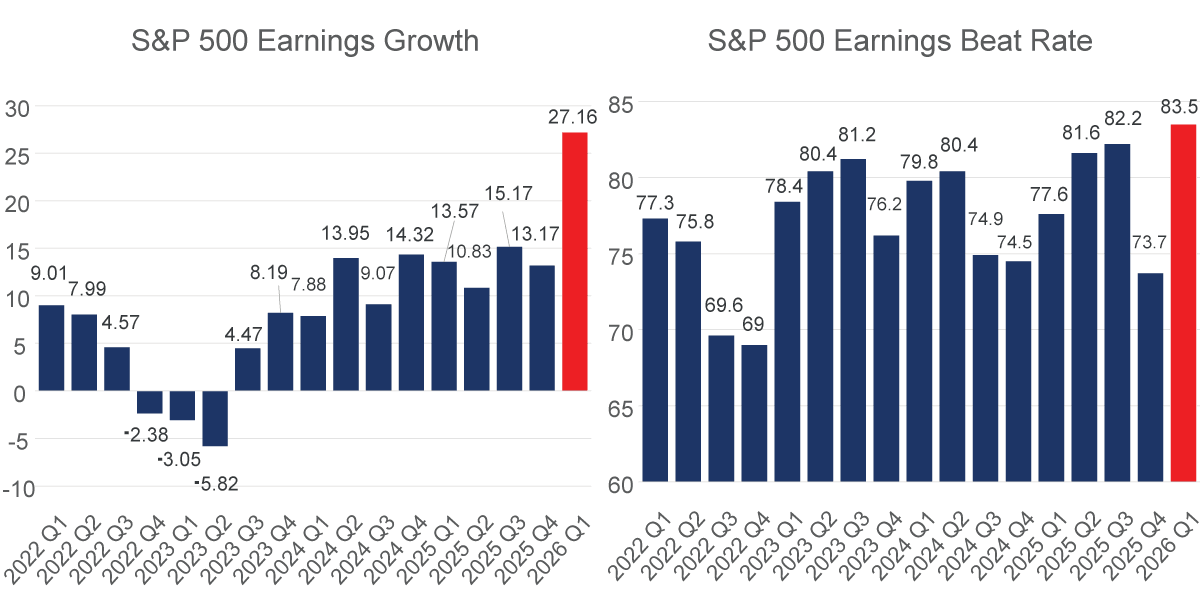
Source: Bloomberg, RBC Rochdale. As of May 7, 2026. Sectors and industries are S&P 1500 sub-indices.
Information is subject to change and is not a guarantee of future results.
International developed markets continue to generate strong absolute returns, with international equities continuing to benefit from diversification and less concentration risk than U.S. markets. So, what’s driving the strong returns? Corporate earnings are leading the way.
Chart 1, 2:25— The first quarter produced one of the best earnings seasons in some time. The S&P 500 earnings growth rate is well exceeding beginning of the year expectations. In addition, the earnings beat rate is surprising to the upside. Technology, Communication Services, Materials, and Discretionary sectors are the standouts. However, the strength is broad and not overly reliant on the leaders. Shift your attention to the bottom right of the table to see impressive earnings growth even when excluding technology, or energy, or the Magnificent 7.
Further, the blended 1Q net profit margin for the S&P 500 is estimated to be 14.7%, per FactSet.
Interestingly, given these strong results, one might expect an even stronger move from stocks. General price reactions have been relatively muted, given the earnings numbers. We think investors are looking forward to 2Q earnings where it is expected that the impacts from the Iran war will filter into the results. Speaking of looking forward… let’s explore what may drive equity markets from here.
What Drives Equity Markets From Here?
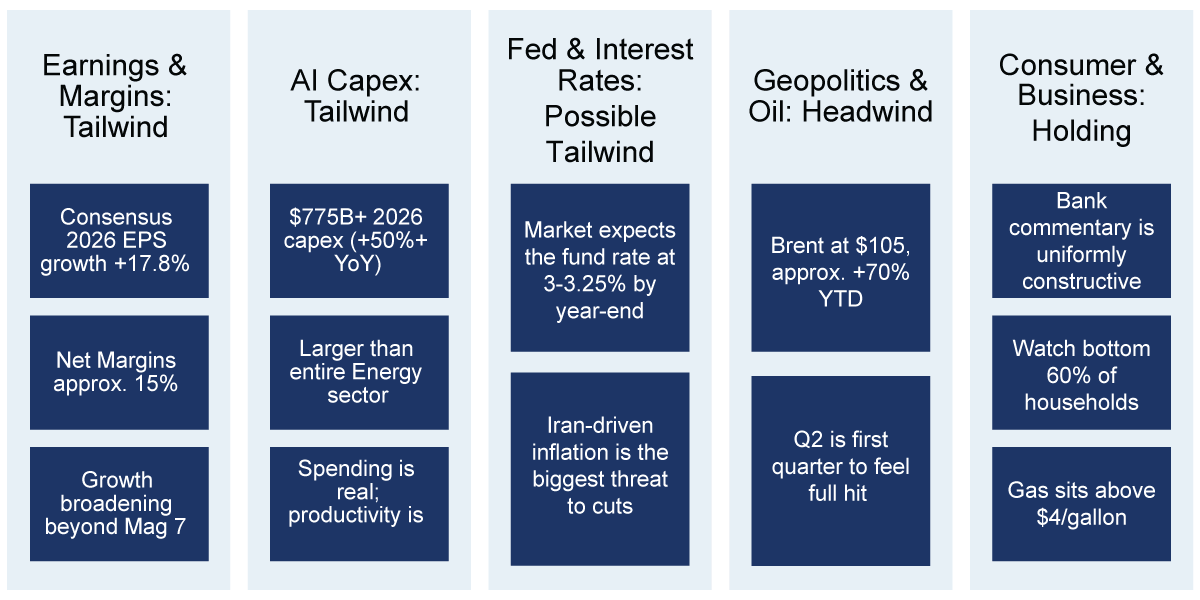
Source: Bloomberg, RBC Rochdale. As of April 24, 2026.
Information is subject to change and is not a guarantee of future results.
Chart 2, 3:06— While earnings are the engine, there are four other important factors. Of the five, we see three that are supportive, one is a challenge, and one is neutral.
Earnings/Margins and AI Cap Ex are tailwinds and should continue to provide support. The Fed and Monetary Policy are a possible tailwind; however, a new Fed Chair, growing dissent within the Fed, and uncertain inflationary pressures insert some doubt as to how much positive support this factor will contribute. Geopolitics and Oil are possible disruptors, while Consumer and Business activity will likely remain a neutral factor.
We’ve been through a lot so far in 2026, and we are not even halfway home. For now, strong fundamentals are carrying the day despite headline uncertainties.
Important Information
The views expressed represent the opinions of RBC Rochdale, LLC which are subject to change and are not intended as a forecast or guarantee of future results. Stated information is provided for informational purposes only, and should not be perceived as personalized investment, financial, legal or tax advice or a recommendation for any security. It is derived from proprietary and non-proprietary sources which have not been independently verified for accuracy or completeness.
While RBC Rochdale believes the information to be accurate and reliable, we do not claim or have responsibility for its completeness, accuracy, or reliability. Statements of future expectations, estimates, projections, and other forward-looking statements are based on available information and management's view as of the time of these statements. Accordingly, such statements are inherently speculative as they are based on assumptions which may involve known and unknown risks and uncertainties. Actual results, performance or events may differ materially from those expressed or implied in such statements.
All investing is subject to risk, including the possible loss of the money you invest. As with any investment strategy, there is no guarantee that investment objectives will be met and investors may lose money. Diversification does not ensure a profit or protect against a loss in a declining market.
Equity investing strategies & products. There are inherent risks with equity investing. These risks include, but are not limited to stock market, manager or investment style. Stock markets tend to move in cycles, with periods of rising prices and periods of falling prices.
RBC Rochdale, LLC is an SEC-registered investment adviser and wholly-owned subsidiary of City National Bank. Registration as an investment adviser does not imply any level of skill or expertise. City National Bank is a subsidiary of the Royal Bank of Canada.
Index Definitions
The Standard & Poor’s 500 Index (S&P 500) is a market capitalization-weighted index of 500 common stocks chosen for market size, liquidity and industry group representation to represent U.S. equity performance.
Nasdaq, Inc. is a global financial services corporation that operates as a stock exchange, providing trading, clearing, technology, and listing services.
The Nasdaq 100 (NDX) is a stock market index tracking 100 of the largest, most actively traded, non-financial companies listed on the Nasdaq exchange. It is heavily weighted toward technology, consumer services, and healthcare, acting as a benchmark for growth-oriented, innovative, large-cap companies.
The MSCI EAFE (Europe, Australasia, and Far East) Index captures large and mid-cap representation across 21 countries, including Japan, UK, and France, that measures the equity market performance of developed markets outside of the U.S. and Canada. It captures roughly 85% of the free float-adjusted market capitalization in each country.
PE (Price-to-Earnings) ratio measures a company's current share price relative to its per-share earnings, acting as an indicator of market valuation, often called an earnings multiple.
Stay Informed.
Get our Insights delivered straight to your inbox.


Put our insights to work for you.
If you have a client with more than $1 million in investable assets and want to find out about the benefits of our intelligently personalized portfolio management, speak with an investment consultant near you today.
If you’re a high-net-worth client who's interested in adding an experienced investment manager to your financial team, learn more about working with us here.
