Rochdale Speedometers: May 2026


We finally made it through another March, and the backdrop continues to be shaped by the war in Iran and the pass-through effect it is having on energy markets, inflation expectations and financial conditions, in addition to secondary effects on petrochemicals and agriculture. The good news is that markets are behaving as if this is a disruption, not a collapse.
Volatility measures can be opaque and, at best, are concurrent, not predictive. But stress this time around has been lower than comparable events like the invasion of Ukraine, which tells us that staying invested remains the best course of action. The better news is that the U.S. economy is entering this period from a position of strength. And maybe most important of all, markets can and often do bottom if they begin to see a path toward resolution.
While the constant barrage of Truth Social posts and conflicting messages from Iranian leadership create frustration, it’s clear that some type of communication is ongoing. This makes the response of the market especially relevant now as the latest developments suggest the White House believes the U.S. could be out of the conflict within two to three weeks. At the same time, there is still a great deal of uncertainty around how passage through the Strait of Hormuz is ultimately resolved and who takes responsibility for reopening it. But here’s the thing: No matter what happens with Iran, the current position of the global economy is still what matters most, and, while we will see impacts from the war, the key will be how long a disruption will last.
From 30,000 feet, the key transmission channel from this conflict is still energy, which directly translates to inflation. There is quite a bit of back-and-forth on time frames with one-year measures of inflation rising, while longer-term measures remain stable. It is these price level changes that often matter most for central banks. And the effects of these shifts are what consumers are facing in real time as gasoline prices move higher.
The takeaway is straightforward: If energy remains elevated for too long, it acts like a tax on consumers and could squeeze corporate margins, the two most important elements of sustained growth. But even with that backdrop, we do not think this is a moment for panic.
The U.S. economy still has important advantages, not the least of which is less energy sensitivity relative to prior shocks and elevated domestic energy production that translates into less reliance on Middle East oil. We are seeing an impact on how consumers feel about the state of play, but if we’ve learned anything since the pandemic, low sentiment doesn’t necessarily translate into lower spending.
Corporate profits remain a stabilizing force and expectations for this quarter continue to climb, while CEO expectations are nowhere near the low levels we saw this time last year. This doesn’t make the U.S. immune, but it’s clear from the global market reaction that the U.S. has a stronger shock absorber than Europe and much of Asia.
On the corporate side, more insulation from the shock has led to calmer nerves. While companies are dealing with a more difficult near-term mix of higher input costs and tighter financial conditions, earnings growth expectations have not fallen apart. Profitability remains a meaningful support to the U.S. outlook and it’s a key reason we did not make broader changes to Speedometers tied to the core U.S. economic engine.
On the consumer side, it’s more nuanced, but hardly a departure from trends over the past year. Confidence has weakened and that makes sense. Households are looking at higher gasoline prices, more headlines and more market volatility. But there is still a gap between softer sentiment and actual behavior. That gap can stay wide without dragging down spending, and for now, it tells us the U.S. consumer is alert to the change in conditions but not materially changing behavior.
There are early signs spending could temporarily slow, but if the energy price spike fades, it will almost certainly rebound. And then there are central banks. The Iran war has made their job more complicated. Higher energy prices raise the risk of another inflation bump, while the growth drag from those same prices argues for caution. In other words, the problem is not just inflation. It is the combination of inflation pressure and slower growth. That is why rates are arguably the best gauge for the economic impact, and, even without a major policy change from the Fed, higher Treasury yields and tighter financial conditions are already doing some of the work to offset near-term price pressure.
That brings us around to the Speedometer changes this month. To properly address the potential future outcomes from the energy shock, we have downgraded Consumer Sentiment, Fiscal Spending, Inflation, Energy Costs, International Economic Outlook and Housing and Mortgages. Interest Rates and Energy Costs moved from green to yellow, while the others remained yellow. We strive to make forward-looking assumptions about the impact of these factors, but given the short-term volatility and various outcomes today, we may adjust the levels more rapidly relative to calmer environments. And the logic behind these changes is consistent.
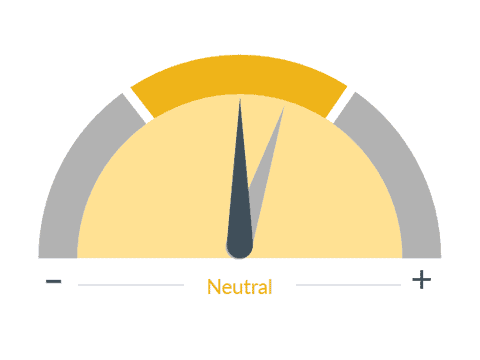
■ Previous Month ■ Current Month
Energy Costs
What we see
Significant changes in energy/oil prices can have important but differing impacts on the overall economy. Higher energy prices act as a tax on consumers and businesses, absorbing money that would normally be used to buy other goods. However, they can also boost production and investment in the mining and energy sectors of the economy. Lower energy prices can increase consumer spending and lower manufacturing costs.
Dial 1: Energy Costs, 5:06— First, Energy Costs moved lower because this is the clearest and most immediate risk from the war. Even if oil does not stay at the most extreme levels, it may settle at a higher level than where it was before the conflict. That has the potential to raise inflation pressure, squeeze consumers and weigh more heavily on non-U.S. economies.
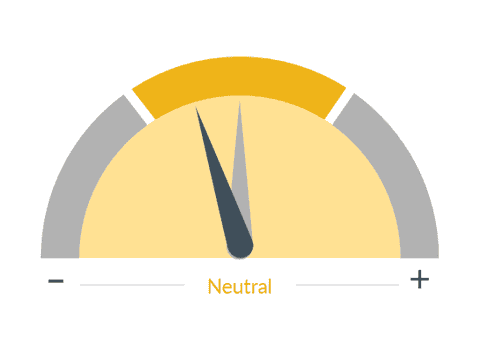
■ Previous Month ■ Current Month
Inflation
What we see
While a slow, persistent rise in prices is consistent with a healthy, growing economy, a rapid increase in inflation, especially if unanticipated, can be harmful. Inflation means higher consumer prices, which often slows sales and reduces profits. Higher prices often lead to higher interest rates. Over time, inflation can also wear away at the value of stocks, which is why it is crucial to monitor.
Dial 2: Inflation, 5:30— Second, Inflation moved lower because the risk has become less favorable. We are not saying inflation will move back to where it was in 2022; in fact, we think that is unlikely. But the path down just got more complicated. Energy prices can interrupt the disinflation story, push expectations higher and delay relief.
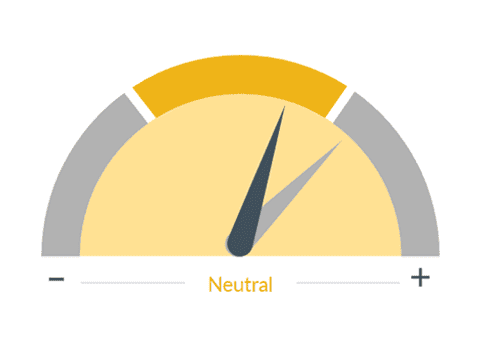
■ Previous Month ■ Current Month
Interest Rates
What we see
Interest rates control the flow of money in the economy. High interest rates curb inflation, but also slow down the economy. Low interest rates stimulate the economy, but could lead to inflation. Interest rates affect the economy slowly. When the Federal Reserve changes the Fed Funds rate, it can take 12-18 months for the effect of the change to percolate throughout the entire economy.
Dial 3: Interest Rates, 5:45— Third, Interest Rates moved lower because the near-term backdrop for rates has become more restrictive. Higher inflation risk tied to energy reduces the market’s confidence in near-term easing and tightens financial conditions. Whether the Fed ultimately cuts later is less important than the fact that rates could become high enough to pressure housing, financing and broader demand in an extended war scenario.
■ Previous Month ■ Current Month
Housing / Mortgages
What we see
Housing is an important indicator of the overall economy and a key driver of investment and job growth. We look at such things as starts, permits, foreclosures, delinquencies, and bank lending to assess the sector's health.
Dial 4: Housing / Mortgages, 6:05— Fourth, our Housing indicator moved lower because of its rate sensitivity, and, despite the short-lived victory of 30-year mortgage rates dropping below 6%, housing will feel the combined effect of higher yields, softer sentiment and more uncertainty.

■ Previous Month ■ Current Month
Consumer Sentiment
What we see
How consumers feel about their overall financial health as well as that of the economy on the short and long term. This is an important indicator, as the consumer is the largest driver of the U.S. economy.
Dial 5: Consumer Sentiment, 6:22— Fifth, Consumer Sentiment moved lower because households are absorbing very negative headlines, higher gasoline prices and market volatility. And while it’s too early to say spending is rolling over, confidence is clearly under pressure.

■ Previous Month ■ Current Month
International Economic Outlook
What we see
The world has become increasingly interconnected through trade and the flow of capital, and emerging markets in particular have risen in importance as drivers of global growth. Moreover, we believe a global perspective is integral to any investment strategy.
Dial 6: International Economic Outlook, 6:35— Last, International Economic Outlook moved lower because the rest of the world is simply more exposed to this shock than the United States. Europe and parts of Asia are more reliant on imported energy, which means they face a sharper inflation-growth tradeoff in the near term.
This doesn’t change our long-term view of non-U.S. markets and the steeper declines we’ve seen in these counties presenting a buying opportunity. Now, just as important as what we changed is what we did not change. We did not change U.S. Economic Outlook, Corporate Profits, Monetary Policy or the broader Consumer Metrics that reflect actual economic behavior. We believe in the underlying resilience of the U.S. economy. And while the policy backdrop is more complicated, we think it is too early to make broader changes to the indicators that speak to the economy’s core strength.
In our view, the right approach this month was to reflect the risk from the war through the transmission channels where it is showing up most clearly, without overstating the damage to the broader expansion. Stepping away from the economic backdrop, the instantaneous market drawdown has been meaningful but orderly. U.S. equities are down about 4% year to date. Energy has been the clear outperformer, while technology and other rate-sensitive sectors have lagged. In fixed income, returns are modestly negative and credit spreads have widened, but not in a way that suggests systemic stress. And when we look at areas garnering attention like private credit, the conclusion is similar. There is more scrutiny, and there should be.
But overall financial system exposure appears to be contained and the public hysteria over limited withdrawals is fierce, but we need to stay focused on the fact that capping withdrawals is a mechanism designed to protect investors against forced selling, and this looks like a story of dispersion and selectivity, not a bomb going off in the broader credit market. Keep in mind that private credit is a small fish in a big pond. Two trillion dollars looks big until you compare it to the $140 trillion public, global debt market.
Finally, I want to close on our positioning. We remain constructive on the U.S. because the economy still has real underlying strength. But we are also not abandoning our conviction in non-U.S. markets. In fact, this is where it is critical to distinguish between today and years from today. The Iran war is an isolated headwind for international markets because of energy exposure. But the structural case for non-U.S. equities remains in place: better valuations, broader earnings growth and policy support in several major economies.
While the near term has been challenging, the longer-term opportunity set is still there. The bottom line is this: The war in Iran has raised risks through energy, inflation and rates. That is why we made the Speedometer changes we did. But the U.S. economy is still standing on a strong foundation, and the longer-term case for global diversification is still intact.
We should stay calm and remember that markets often begin to recover not when the news is good, but when investors begin to see a credible path toward less uncertainty. And right now, any believable sign of resolution to the Iran war will matter a great deal.
RBC Rochdale, LLC is an SEC-registered investment adviser and wholly-owned subsidiary of City National Bank. Registration as an investment adviser does not imply any level of skill or expertise. City National Bank is a subsidiary of the Royal Bank of Canada.
The information presented does not involve the rendering of personalized investment, financial, legal or tax advice. This presentation is not an offer to buy or sell, or a solicitation of any offer to buy or sell any of the securities mentioned herein.
Certain statements contained herein may constitute projections, forecasts and other forward-looking statements, which do not reflect actual results and are based primarily upon a hypothetical set of assumptions applied to certain historical financial information. Certain information has been provided by third-party sources and, although believed to be reliable, it has not been independently verified and its accuracy or completeness cannot be guaranteed.
Any opinions, projections, forecasts, and forward-looking statements presented herein are valid as of the date of this document and are subject to change.
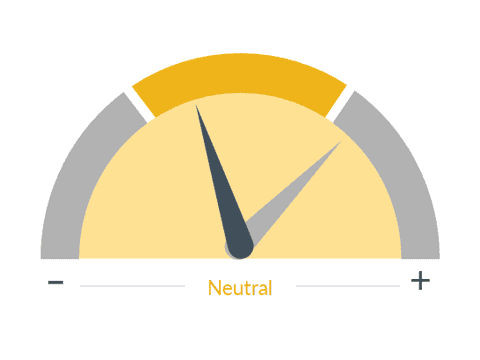
Rochdale Speedometers are indicators that reflect forecasts of a 6-to-9-month time horizon. The colors of each indicator, as well as the direction of the arrows represent our positive/negative/neutral view for each indicator. Thus, arrows directed towards the (+) sign represents a positive view which in turn makes it green. Arrows directed towards the (-) sign represents a negative view which in turn makes it red. Arrows that land in the middle of the indicator, in line with the (0), represents a neutral view which in turn makes it yellow. All of these indicators combined affect RBC Rochdale’s overall outlook of the economy.
RBC Rochdale, LLC., its managed affiliates and subsidiaries, as a matter of policy, do not give tax, accounting, regulatory, or legal advice, and any information provided should not be construed as such.
All investing is subject to risk, including the possible loss of the money you invest. As with any investment strategy, there is no guarantee that investment objectives will be met and investors may lose money. Diversification does not ensure a profit or protect against a loss in a declining market. Past performance is no guarantee of future results.
©2026 RBC Rochdale, LLC. All rights reserved.