Market Perspectives: May the Stocks Be With You


It feels like summer was just a blink and it’s clear the market is gearing up for the last four months of 2025.
The data remains somewhat mixed, but the overall growth picture looks good for the third quarter. Activity measures are improving overall, and fears of a near-term recession have eased. Our baseline view is that the economy will avoid recession, and in fact, the probability of a downturn has trended significantly lower since the start of the year. The one area that’s starting to become a problem is employment. The most recent report was disappointing, with payrolls growing by only 22,000 versus expectations of 78,000, and the unemployment rate ticking up to 4.3%. This all but seals a Fed rate cut at its September seventeenth meeting. The committee began shifting its stance on monetary policy back in July, and with today’s labor market data, most members have now upgraded their view for September.

■ Previous Month ■ Current Month
Monetary Policy
What we see
Monetary policy is one of two ways the government can influence the economy and financial markets. By manipulating interest rates, the Federal Reserve can raise or lower the cost of money to stabilize or stimulate the economy.
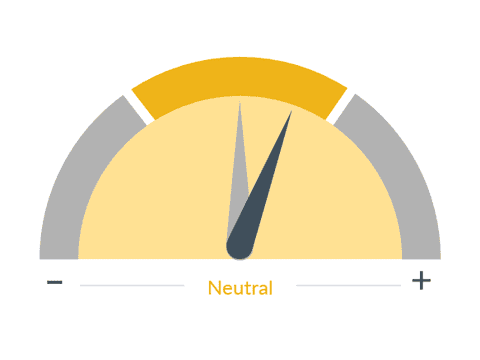
Dial 1: Monetary Policy, 1:12— Our Monetary Policy Speedometer has moved into the green. Rate cuts are now not just likely, but nearly certain as we approach the end of the year. Looking ahead, we expect a gradual series of cuts over the next six to nine months. History tells us that Fed easing tends to be supportive for most asset classes, especially equities, with small caps and lower-quality stocks often outperforming when recession is avoided.
■ Previous Month ■ Current Month
Yield Curve
What we see
The shape of the yield curve gives an idea of future interest rate changes and economic activity. There are three common yield curve shapes: normal, inverted, and flat. A normal yield curve is one in which longer maturity bonds have a higher yield compared to shorter-term bonds, due to the risks associated with time, and can signal improving economic growth.
Dial 2: Yield [Rate] Curve, 1:34— We also upgraded our Rates Speedometer, which remains yellow but is likely to go green if the current environment stays in place. The combination of weaker job growth, muted consumer demand, and moderating inflation suggests that ten-year yields will remain stable or drift lower from here. Lower borrowing costs should provide some relief to households and businesses, even if lending standards get a little bit tighter.
On the consumer side, spending is not much above its December level, but it’s still solid. Wages are growing faster than inflation, which is helping to offset tariff-related price pressures. Balance sheets remain healthy, though confidence is fragile and very responsive to fiscal and monetary policy developments. This fits with what we’re hearing on Main Street: households are cautious, but they’re still spending, and businesses are investing where they see durable demand, particularly around technology and artificial intelligence.
Stocks still have room to move a little higher, supported by strong corporate earnings and continued AI-driven capital investment, but we need to acknowledge the risks. Policy risk remains, with tariffs and fiscal negotiations still in flux. Geopolitical risk persists in Eastern Europe and the Middle East. Labor market revisions may create further uncertainty. And U.S. equities remain heavily concentrated in a handful of very large technology companies, which means market performance is vulnerable if expectations around spending or profitability change. That places asset allocation at the forefront of our thinking. We’re scanning the market for areas that may be more stable if tech leadership starts to falter.
One of the biggest areas of interest is the increasingly constructive case for international equities. There are several reasons. Capital flows are beginning to shift toward foreign markets as investors weigh the impact of U.S. policy decisions and potential changes in leadership. Relief on the tariff front is creating better visibility, as trade deals reduce uncertainty and open opportunities abroad. International markets also offer more durable sector balance compared to the technology-heavy U.S., helping with diversification and risk reduction. Valuations are historically attractive on a relative basis. And finally, defense spending is poised to increase globally, particularly in Europe, as the U.S. takes a step back from its traditional role as global insurer. For now, it remains an area of growing interest, and one we continue to monitor closely.
As we head into September, the key message is steady improvement in the policy backdrop, with monetary easing now in place, rates moving in the right direction and recession risk fading. Consumers and businesses are still participating in growth, even if cautiously. Equities remain supported by earnings, but risks require discipline. And on the horizon, international markets are starting to look more attractive. It’s a moment that calls for patience, perspective and a balanced approach.
The information presented does not involve the rendering of personalized investment, financial, legal or tax advice. This presentation is not an offer to buy or sell, or a solicitation of any offer to buy or sell any of the securities mentioned herein.
Certain statements contained herein may constitute projections, forecasts and other forward-looking statements, which do not reflect actual results and are based primarily upon a hypothetical set of assumptions applied to certain historical financial information. Certain information has been provided by third-party sources and, although believed to be reliable, it has not been independently verified and its accuracy or completeness cannot be guaranteed.
Any opinions, projections, forecasts, and forward-looking statements presented herein are valid as of the date of this document and are subject to change.
Rochdale Speedometers® are indicators that reflect forecasts of a 6-to-9-month time horizon. The colors of each indicator, as well as the direction of the arrows represent our positive/negative/neutral view for each indicator. Thus, arrows directed towards the (+) sign represents a positive view which in turn makes it green. Arrows directed towards the (-) sign represents a negative view which in turn makes it red. Arrows that land in the middle of the indicator, in line with the (0), represents a neutral view which in turn makes it yellow. All of these indicators combined affect RBC Rochdale’s overall outlook of the economy.
City National, its managed affiliates and subsidiaries, as a matter of policy, do not give tax, accounting, regulatory, or legal advice, and any information provided should not be construed as such.
All investing is subject to risk, including the possible loss of the money you invest. As with any investment strategy, there is no guarantee that investment objectives will be met and investors may lose money. Diversification does not ensure a profit or protect against a loss in a declining market. Past performance is no guarantee of future results.
RBC Rochdale, LLC, is a SEC registered investment adviser and wholly owned subsidiary of City National Bank. Registration as an investment adviser does not imply any level of skill or expertise. City National Bank and RBC Rochdale are subsidiaries of Royal Bank of Canada.
©2025 RBC Rochdale, LLC. All rights reserved.
NON-DEPOSIT INVESTMENT PRODUCTS ARE: • NOT FDIC INSURED •NOT BANK GUARANTEED •MAY LOSE VALUE