
-
Market Perspectives
Midpoint
June 2024
- Filename
- Market Perspectives JUNE 2024.pdf
- Format
- application/pdf
.jpg "Charles Boettcher, CPWA®")
TRANSCRIPT
We are approaching the midway point, and the S&P 500 continues to hum along, sitting at around 15% year-to-date as of filming. Market participation continues to broaden. More sectors have contributed to the market's advance this year as confidence in the outlook has improved. Corporate earnings have helped. Results from the first-quarter earnings season, which did surprise to the upside, support our outlook for corporate profit growth to remain positive and reinforce our belief that the S&P 500 earnings are on track to grow around 10% this year. And while we acknowledge that evaluations do remain high, we do not think this means we are in for negative returns.
Our research shows that over the long-term horizons, high valuations tend to impact the magnitude of the stock market's returns, but they've historically been poor indicators of market direction.
S&P 500 Consensus Y/Y Earnings Growth
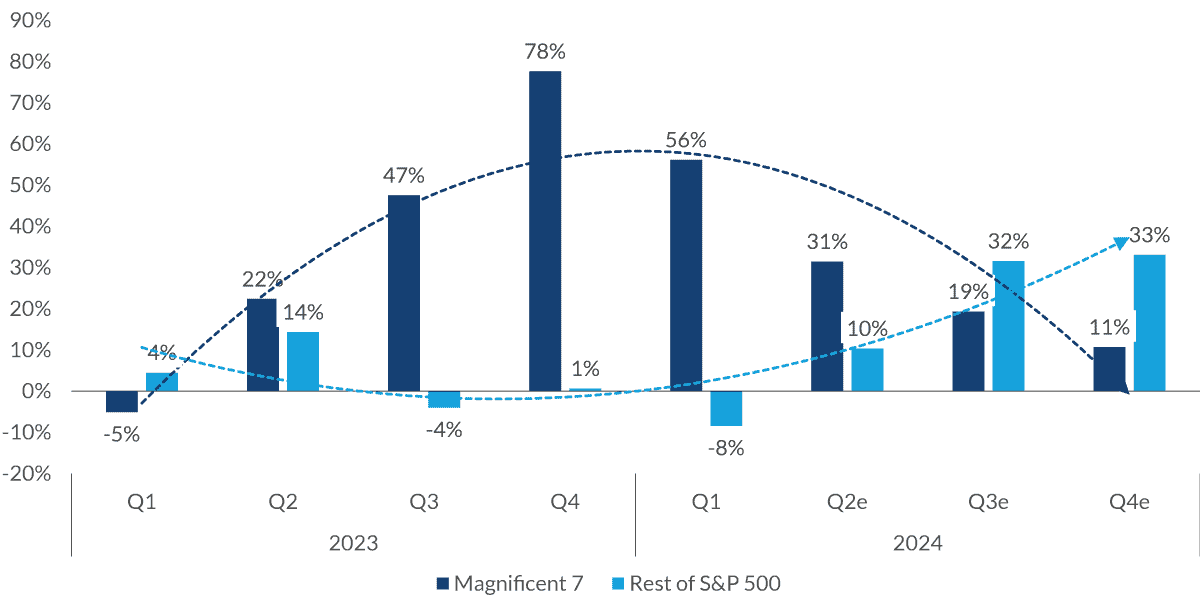
Sources: FactSet, as of May 2024.
Information is subject to change and is not a guarantee of future results.
Chart 1: 1:08— You've heard me say repeatedly that the market is broadening — a good sign. And it's been well documented that last year's returns were driven by a small number of tech stocks. Well, the same paradigm applied to corporate earnings, and that too shows signs of broadening as high comparisons begin to impact tech stocks and broader market earnings are accelerating. This is impacting our recommended sector weights and equity positioning.
Turning to fixed income: The higher for longer theme continues to play out with 10-year treasury rates at fair value between 4.1% and 4.6%.
Attractive yields offer opportunities for investors across the curve. Increasing supply and narrow spreads across both investment-grade and high-yield sectors has been met with robust demand providing a strong vote of confidence for the market. Municipal bonds offer compelling value for investors in both high tax brackets and high tax states.
And higher levels of income suggest the risk reward of extending maturities is well balanced.
Since we are at midyear, I can't put it off any longer. Let's talk [about the] election. After all, the European Union just kicked off the season in a big way with their parliamentary elections. In the coming months, you can count on me dusting off those election-related charts that you see every four years. And you thought the cicadas were bad. Over the next five months, the noise will increase. And no doubt, we will be bombarded by charts, statistics, arguments using various time periods and relative numbers. Just remember to keep a critical mind while consuming.
S&P 500 Performance
Over U.S. Presidential Election Cycles
(1928-2023)
Source: Factset, as of January 2024.
Past performance is no guarantee of future results.
Chart 2: 2:48— For now, let's focus on some general points. Presidential election years tend to be good for the S&P 500. Only five presidential election years since 1928 have seen negative returns. Over the long run, equities have historically performed well regardless of political party control of the government. Remember, corporate profits, interest rates and fed policy direction tend to be more important.
More specific to this U.S. election, the U.S. long-term market impact is likely revolving around three T's: tariffs, taxes, treasuries.
Tariffs will be key to each party's political agenda and will increase in importance as the election approaches. Further political escalation could impede growth and create inflationary pressure in the long run.
Taxes: Portions of the Tax Cuts and Jobs Act are up for extension in 2025. Extension is likely despite election outcome, but fiscal austerity and lack of offsetting revenue may hinder efforts.
Treasury issuance is projected to increase to over $3 trillion by 2029. Increased issuance of longer-term maturities will continue to put pressure on the level of interest rates. Foreign buyers now represent a much smaller percentage of outstanding treasury debt. U.S. buyers are stepping in to fill the gap but are more price sensitive, which may increase interest rate volatility.
And one last thing to keep in mind: This election is unique in that the market has experienced both candidates occupying the Oval Office. This reduces one potential risk that we typically see in elections, and that's uncertainty. The markets are familiar with both candidates.
No matter the outcome in November, we will be watchful over the long-term impact of the three T's on growth, inflation, government debt and interest rates.
Important Information
The views expressed represent the opinions of City National Rochdale, LLC (CNR) which are subject to change and are not intended as a forecast or guarantee of future results. Stated information is provided for informational purposes only, and should not be perceived as personalized investment, financial, legal or tax advice or a recommendation for any security. It is derived from proprietary and non-proprietary sources which have not been independently verified for accuracy or completeness.
While CNR believes the information to be accurate and reliable, we do not claim or have responsibility for its completeness, accuracy, or reliability. Statements of future expectations, estimates, projections, and other forward-looking statements are based on available information and management's view as of the time of these statements. Accordingly, such statements are inherently speculative as they are based on assumptions which may involve known and unknown risks and uncertainties. Actual results, performance or events may differ materially from those expressed or implied in such statements.
Past performance or performance is no guarantee of future results.
All investing is subject to risk, including the possible loss of the money you invest. As with any investment strategy, there is no guarantee that investment objectives will be met and investors may lose money. Diversification does not ensure a profit or protect against a loss in a declining market.
City National Rochdale, LLC, is an SEC-registered investment adviser and wholly owned subsidiary of City National Bank. Registration as an investment adviser does not imply any level of skill or expertise. City National Bank and City National Rochdale are subsidiaries of Royal Bank of Canada.
© 2024 City National Rochdale. All rights reserved.
Index Definitions
The Standard & Poor’s 500 Index is a market capitalization-weighted index of 500 common stocks chosen for market size, liquidity, and industry group representation to represent US equity performance.
The Dow Jones U.S. Select Dividend Index aims to represent the U.S.'s leading stocks by dividend yield.
MSCI All Country World Index (ACWI):The MSCI All Country World Index (ACWI) is a stock index designed to track broad global equity-market performance.
The Bloomberg US Aggregate Bond Index measures the performance of investment grade, US dollar-denominated, fixed-rate taxable bonds.
The Bloomberg US Municipal Bond Index measures the performance of investment grade, US dollar-denominated, long-term tax-exempt bonds.
The Magnificent 7: The seven companies commonly recognized for their market dominance, their technological impact, and their changes to consumer behavior and economic trends: Alphabet (GOOGL; GOOG), Amazon (AMZN), Apple (AAPL), Meta Platforms (META), Microsoft (MSFT), NVIDIA (NVDA), and Tesla (TSLA).
