
-
Fixed Income Perspectives
Bonds On Firm Footing Despite Policy Uncertainty
August 2025
- Filename
- Fixed Income Perspectives AUGUST 2025.pdf
- Format
- application/pdf

TRANSCRIPT
With the second half of the year underway, fixed income markets continue to navigate the now familiar themes of heightened volatility, mixed economic data, trade uncertainty and shifting monetary policy expectations.
Fixed Income Asset Class Performance
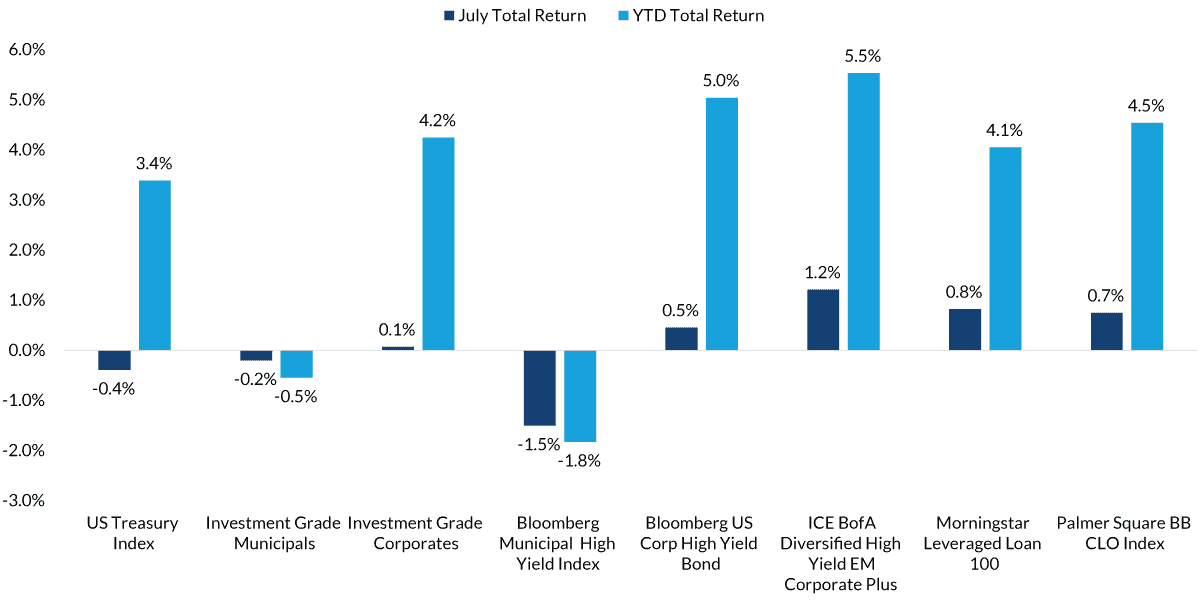
Source: Morningstar Leveraged Loan 100 Index, Bloomberg US Corporate High Yield Index, ICE BofA Diversified High Yield EM Corporate Plus Index, Palmer Square BB CLO Index, Bloomberg Municipal Bond Index, Bloomberg US Treasury Index, Bloomberg High Yield Municipal Bond Index and Bloomberg US Corporate Investment Grade Index as of 7/31/2025. Past performance is not a guarantee of future results.
Chart 1, 0:27– As a result, July performance was uneven, with U.S. treasuries losing 40 basis points, while broader investment grade and high-yield credit markets remain resilient. The municipal bond market has lagged this year, but a closer look at performance shows short- and intermediate-term bonds have delivered positive total returns. Year to date, most fixed income asset classes have posted gains with attractive income opportunities continuing to support steady demand.
U.S. Corporate Bond Spreads Have Tightened
Source: Bloomberg US Agg Credit Average Option-Adjusted Spread (OAS) and Bloomberg US Corporate High Yield Average OAS as of 8/12/2025. Information is subject to change and is not a guarantee of future results.
Chart 2, 0:56– In the credit markets, tariff-driven headline risks and fiscal policy changes have failed to derail performance. After spiking higher in April, both investment grade and high-yield issuer credit spreads have tightened and remain near the low end of their historical range. The strength of the economy has helped support bond prices while corporate balance sheets remain broadly healthy.
Earnings are on track to expand at a double-digit pace for the third consecutive quarter, further underpinning fundamentals despite moderating global growth. The technical backdrop continues to be a tailwind as debt issuance has failed to keep up with investor appetite for bonds. Overall, we remain constructive on the credit markets and believe nominal yields offer long-term return upside despite relatively full valuations. Mixed economic data has kept markets on edge in recent weeks. As expected, the July FOMC meeting left rates unchanged. Despite the dissent from two committee members, the consensus is that durable economic performance, combined with inflation risks from trade and tariff policies, will keep the Fed on hold for the time being. However, July payroll data showed weaker than expected job creation and sizable downward revisions, suggesting a cooling labor market.
2-Yr and 10-Yr US Treasury Yields
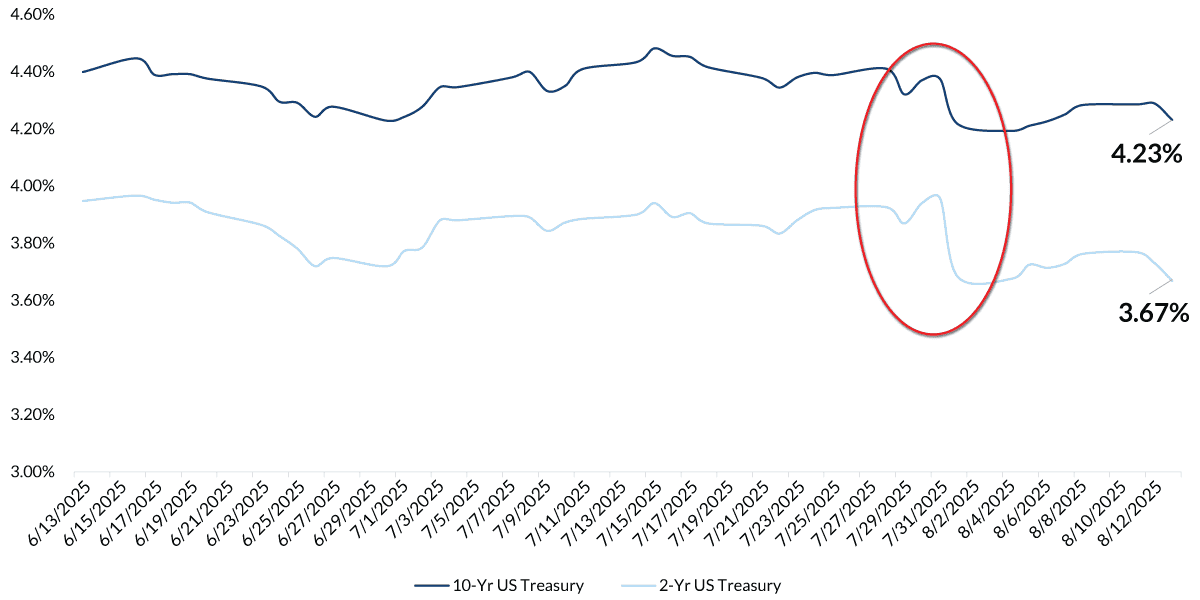
Source: Bloomberg U.S. Treasury Index 2-Yr and 10-Yr Yields as of 8/13/2025. Information is subject to change and is not a guarantee of future results.
Chart 3, 2:17– As a result, two- and ten-year U.S. Treasury yields have moved lower across most maturities in August, and markets are currently pricing in a higher probability of easing at the next Fed meeting in September.
Federal Funds Futures:
September 2025 Change from Current Rate
implied, based on federal funds futures market
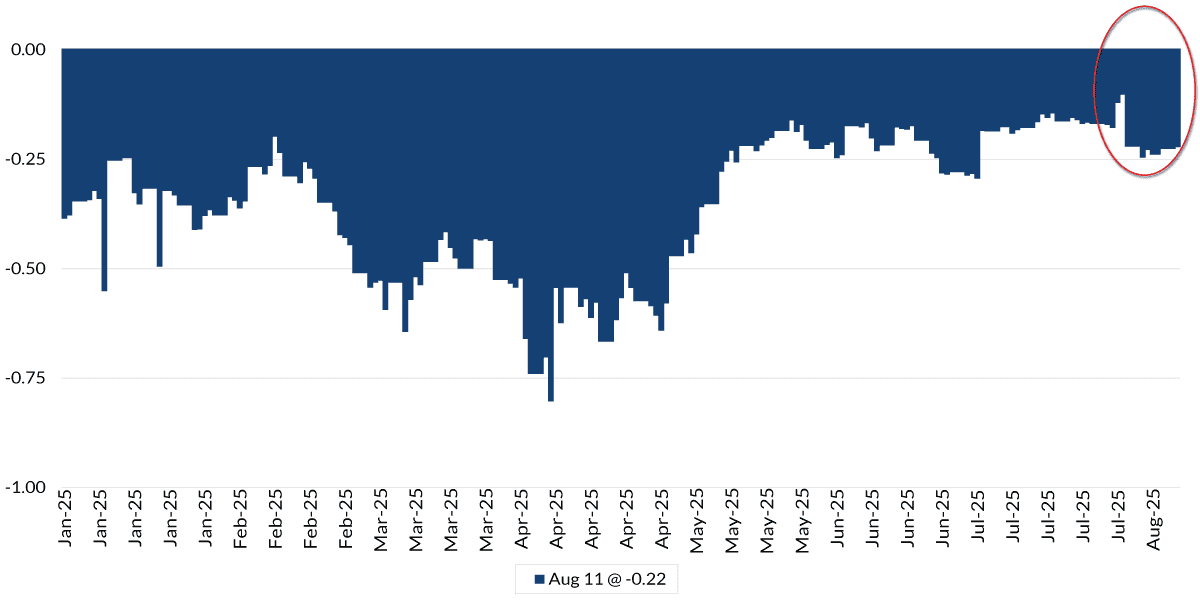
Source: Federal Reserve Bank and Bloomberg WIRP as of 8/11/2025. Information is subject to change and is not a guarantee of future results.
Chart 4, 2:29– In the coming weeks, investors will look for signals of the Fed’s next steps from Chairman Powell at Jackson Hole, as well as upcoming data releases for jobs and inflation ahead of the September meeting.
In summary, bond markets have been resilient this year, with most sectors delivering positive, solid total returns. In fact, at the time of writing, longer maturity municipal bonds are showing signs of recovery and the broad municipal market is now positive for the year.
We believe fixed income investors will continue to benefit from attractive nominal yields and income opportunities, improving total return potential in the coming months. We also see growing evidence that yields may finally begin to drift lower. The Federal Reserve has not resumed rate cuts yet, but forward-looking indicators such as slowing growth, moderating inflation and a softening labor market suggest that policy easing is increasingly likely before year-end.
In that context, over the next nine months, we now see a greater probability the 10-year Treasury yield could fall below 4% and remain there sustainably into 2026.
Important Information
The views expressed represent the opinions of City National Rochdale, LLC (CNR) which are subject to change and are not intended as a forecast or guarantee of future results. Stated information is provided for informational purposes only, and should not be perceived as personalized investment, financial, legal or tax advice or a recommendation for any security. It is derived from proprietary and non-proprietary sources which have not been independently verified for accuracy or completeness. While CNR believes the information to be accurate and reliable, we do not claim or have responsibility for its completeness, accuracy, or reliability. Actual results, performance or events may differ materially from those expressed or implied in such statements.
All investing is subject to risk, including the possible loss of the money you invest. As with any investment strategy, there is no guarantee that investment objectives will be met, and investors may lose money. Diversification does not ensure a profit or protect against a loss in a declining market. Past performance is no guarantee of future performance.
City National Rochdale, LLC is an SEC-registered investment adviser and wholly-owned subsidiary of City National Bank. Registration as an investment adviser does not imply any level of skill or expertise. City National Bank is a subsidiary of the Royal Bank of Canada.
Fixed Income investing strategies & products. There are inherent risks with fixed income investing. These risks include, but are not limited to, interest rate, call, credit, market, inflation, government policy, liquidity or junk bond risks. When interest rates rise, bond prices fall. This risk is heightened with investments in longer-duration fixed income securities and during periods when prevailing interest rates are low or negative.
Index Definitions:
The Morningstar Global Leveraged Loan 100 Index is designed to measure the performance of the 100 largest facilities in the global leveraged loan market. It is a fixed-weight composite index consisting of 75% weight from the Morningstar LSTA US Leveraged Loan Index and 25% weight from the Morningstar European Leveraged Loan Index with a 2% cap on individual loan weight.
The Bloomberg US Corporate High Yield Index measures the performance of non-investment grade, US dollar-denominated, fixed-rate, taxable corporate bonds.
ICE BofA Diversified High Yield US Emerging Markets Corporate Plus Index tracks the performance of US dollar denominated below investment grade emerging markets non-sovereign debt publicly issued in the major domestic and Eurobond markets.
The Palmer Square CLO Debt Index (“CLO Debt Index”) (ticker: CLODI) is a rules-based observable pricing and total return index for collateralized loan obligation (“CLO”) debt for sale in the United States, original rated A, BBB, or BB or equivalent.
The Bloomberg Municipal Bond: Muni Inter-Short (1-10) Index is a measure of the US municipal tax-exempt investment grade bond market. It includes general obligation and revenue bonds, which both can be pre-refunded years later and get reclassified as such. The effective maturity of the bonds in the index must be greater than or equal to 1 years but less than 10 years.
Bloomberg U.S. Treasury Index: includes all publicly issued, U.S. Treasury securities that are rated investment grade, and have $250 million or more of outstanding face value.
Bloomberg U.S. Municipal High-Yield Index: covers the U.S.-dollar denominated, non-investment grade, fixed-rate, municipal bond market and includes securities with ratings by Moody’s, Fitch and S&P of Ba1/BB+/BB+ or below.
The Bloomberg US Corporate Index measures the investment grade, fixed-rate, taxable corporate bond market. It includes USD denominated securities publicly issued by US and non-US industrial, utility, and financial issuers.
The Bloomberg US Agg Credit Average Option-Adjusted Spread (OAS) is a measure used to assess the additional yield investors receive for holding bonds included in the credit-related sectors of the Bloomberg US Aggregate Bond Index, compared to a risk-free benchmark.
The Bloomberg US Corporate High Yield Average OAS (Option-Adjusted Spread) is a measure that reflects the average yield spread above the risk-free rate for bonds included in the Bloomberg US Corporate High Yield Bond Index. This index tracks the performance of US dollar-denominated, fixed-rate, high-yield corporate bonds.
Bloomberg U.S. Treasury 2-Yr Yield: Reflects the annual return an investor can expect from holding a 2-year US Treasury note until maturity. This is a short-term indicator, influenced by factors like the Federal Reserve's short-term interest rate policy and market expectations for near-term economic activity.
Bloomberg U.S. Treasury 10-Yr Yield: Represents the interest rate the U.S. government pays to borrow money for a decade. This yield is seen as a benchmark for longer-term interest rates and is influenced by factors such as investor sentiment about the economy, inflation expectations, and global economic conditions.
Bloomberg's World Interest Rate Probabilities (WIRP) function is a tool within the Bloomberg Terminal that estimates future interest rate changes based on market pricing of financial instruments like Fed funds futures and overnight index swaps. It provides insights into market expectations for central bank policy rate adjustments, allowing users to gauge the probability of rate hikes or cuts at upcoming meetings.
© 2025 City National Rochdale, LLC. All rights reserved.
