
-
Fixed Income Perspectives
While waiting for the Fed, bonds offer opportunities
May 2024
- Filename
- Fixed Income Perspectives MAY 2024.pdf
- Format
- application/pdf

Series Overview
Watch this new monthly video series featuring Director of Fixed Income, Micheal Talia, as he discusses trends within the macroeconomic landscape affecting Fixed Income markets and interest rates.
After 20+ years of zero interest rate policy, an entirely new set of opportunities is available to investors with higher yields and more dispersion, which have the potential to positively impact returns. Mike will help dismantle the complexity of bonds by exploring the differences between asset types and distilling the labyrinth of economic factors into what matters most for investors.
TRANSCRIPT
Today, I'm going to discuss some of the recent events that have influenced the bond markets and touch on where we see opportunities across the yield curve in the current environment.
U.S. Treasury Curve Comparison & YTD Yield Change (BPS)
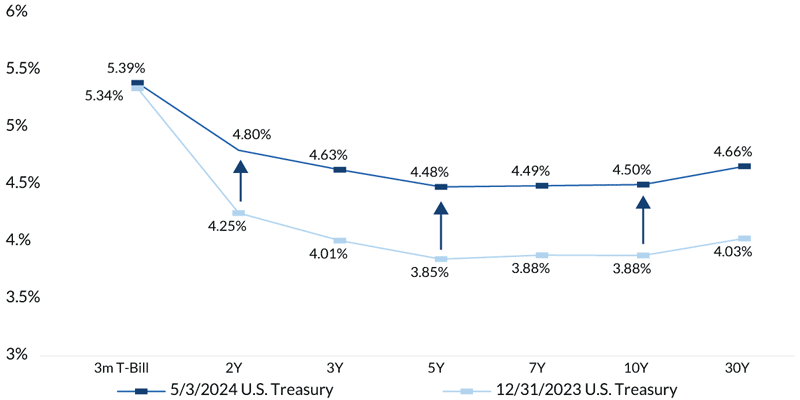
Diversification does not ensure a gain or protect against a loss. Sources: Bloomberg, CNR Research, as of April 2024. Information is subject to change and is not a guarantee of future results.
Turning our attention first to the yield curve, this most recent period has been marked by volatility as the markets navigate good economic growth, sticky inflation, and changing expectations on Fed policy. Through this, we saw the 10-year U.S. Treasury peak at 5% in October of last year, before dropping sharply to just under 4% to close out the year.
Chart 1: 0:44– More recently, we've experienced a steady increase in rates with yields higher by over 50 basis points across the curve. Now, we attribute much of this to concerns about persistent inflationary pressures over the last several months, and this has effectively forced the market to rethink the timing and quantity of Fed cuts. The market has gone from expecting 7 cuts at the start of the year to just 1 to 2 by year end, and as a result, it appeared as if the Treasury curve could retest the highs that we experienced last fall.
However, the first week of May brought several important data points to consider.
First, the FOMC meeting left rates unchanged for the sixth consecutive meeting, and while acknowledging a lack in further progress toward its inflation goal, Chairman Powell indicated policy remained restrictive and noted a bias for rate cuts when appropriate. Additionally, the FOMC brought the balance sheet into focus with the decision to slow the pace of runoff from 60 billion per month to 25 billion dollars, and this came in slightly more than the market participants had anticipated.
Yield Levels Across Select Fixed Income Asset Classes
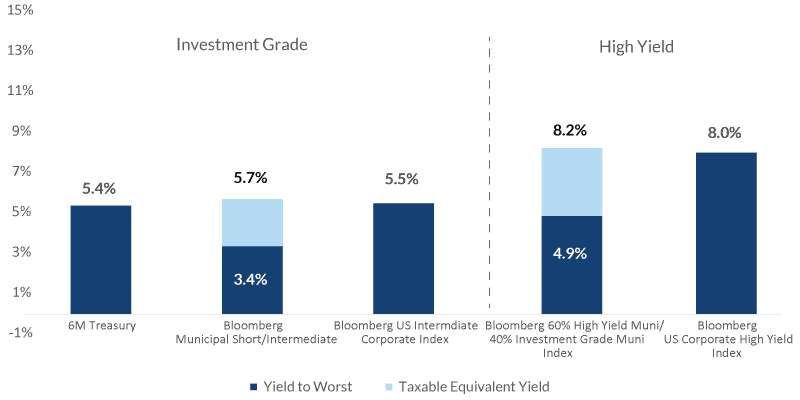
Source: As of May 3, 2024. Bloomberg. Taxable Equivalent Yield (TEY) assumes 37% Federal and 3.8% Medicare taxes. Information is subject to change and is not a guarantee of future results. Diversification does not ensure a gain or protect against a loss.
But more importantly, this action introduces a marginal buyer into the rates market of about 35 billion dollars a month, potentially helping support rates at current levels. And finally, job growth slowed in April, with payroll data coming in below expectations and downward revisions to the prior two months. With this report, it appears the labor market might be downshifting and coming into balance.
While this wasn't the type of weakness that would force a rate cut, the data should help the Fed and market regain confidence that inflation will be contained, eliminating the need for further rate hikes. Taken together, our view for some time has been a higher-for-longer environment for rates.
Chart 2: 2:42– We believe that we will see 1 to 2 rate cuts from the Fed this year, and further out, the curve rates will remain above 4% for the remainder of the year, likely trading in a range between 4 and 4.5%, and with this in mind, we see opportunities across the curve for fixed income investors.
For those with shorter time horizons or specific liquidity needs, we continue to find value in short maturities, with 6-month T-bills yielding close to 5.4% and 2-year Treasury notes recently as high as 5%.
For those with a longer horizon, we favor portfolios with an average maturity of approximately 5 years. For example, the Bloomberg Intermediate Corporate Bond Index currently yields an average of 5.5%, and the yield on the Short Intermediate Municipal Index with maturities between 1 and 10 years currently averages 3.4%.
Adjusting the nominal municipal yield for a maximum 37% Fed rate, and a 3.7% Medicare tax, this equates to a 5.7% taxable equivalent yield. For investors in high-tech states such as California and New York, owning municipal bonds can be even more advantageous.
And finally, with credit quality resilient and economic activity above trend, we believe this supports tight credit spreads in the higher-yielding segments of the market.
Important Information
The views expressed represent the opinions of City National Rochdale, LLC (CNR) which are subject to change and are not intended as a forecast or guarantee of future results. Stated information is provided for informational purposes only, and should not be perceived as personalized investment, financial, legal or tax advice or a recommendation for any security. It is derived from proprietary and non-proprietary sources which have not been independently verified for accuracy or completeness. While CNR believes the information to be accurate and reliable, we do not claim or have responsibility for its completeness, accuracy, or reliability. Actual results, performance or events may differ materially from those expressed or implied in such statements. All investing is subject to risk, including the possible loss of the money you invest. As with any investment strategy, there is no guarantee that investment objectives will be met, and investors may lose money. Diversification does not ensure a profit or protect against a loss in a declining market. Past performance is no guarantee of future performance.
City National Rochdale, LLC, is a SEC-registered investment adviser and wholly owned subsidiary of City National Bank. Registration as an investment adviser does not imply any level of skill or expertise. City National Bank and City National Rochdale are subsidiaries of Royal Bank of Canada.
