
-
Market Perspectives
Shutdown Spooking Stocks?
October 2025
- Filename
- Market Perspectives OCTOBER 2025.pdf
- Format
- application/pdf
.jpg "Charles Boettcher, CPWA®")
TRANSCRIPT
This month’s front-page topic is the government shutdown. By a wide margin, the most frequent question from clients and advisors is why isn’t the stock market reacting negatively to the shutdown.
Historically, shutdowns have had limited lasting impact on the economy or markets. Stocks often recover quickly from shutdown-related volatility. Shutdowns are disruptive but rarely disastrous.
Shutdown Details
Budget vs. Rochdale
- Ann. budget & Appropriation:
- Budget resolution: a high level, non-binding blueprint that sets total spending and revenue targets.
- Appropriations Bills: Separate, binding laws that actually fund each part of the government for the new fiscal year.
- Continuing Resolution:
- Stopgap that extends last year’s funding levels for a set period while Congress negotiates.
- Without a CR, the government shuts down.
- Republicans do not have a filibuster proof majority, so they need some Democrats to pass a CR.
The Sticking Points?
- Enhanced ACA premium tax credits/subsidies
- What they do: lower monthly premiums for enrollees in ACA plans.
- Subsidies were expanded during COVID and have been more generous than original law’s baseline.
- Set to expire at end of year.
- Rolling back/reversing recent cuts to Medicaid made by OBBBA.
- Restoration of funding cuts made by 2025 Rescissions Act.
- Trump Admin. and Congress passed an act to rescind appropriated funds.
- Democrats seeking to restore.
- Reversing limits affecting non-citizens and/or making them eligible for ACA or Medicaid.
Source: Rochdale Research as of October 2, 2025.
Information is subject to change and is not a guarantee of future results.
Chart 1, 0:40— Mandatory spending such as Social Security and Medicare continues, while Treasury interest payments go out as usual. The main drag comes from furloughed workers, delayed government contracts and missing economic data. The rule of thumb is that each week of shutdown shaves about 0.1-0.2 percentage points from GDP growth, which is typically reversed once the government reopens. In other words, markets often look past the noise.
How Does the Market Do During Shutdowns?
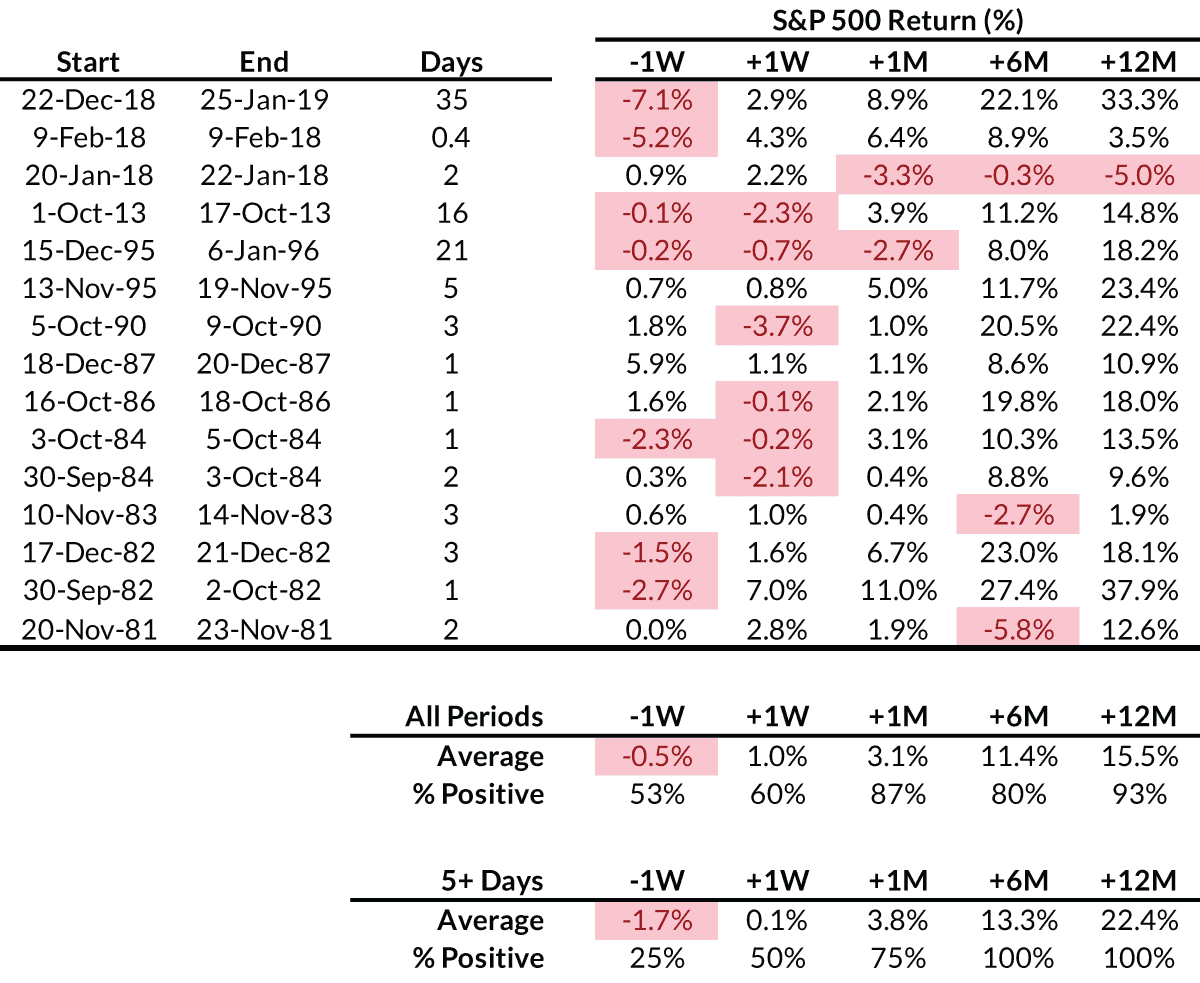
Sources: Bloomberg and Evercore ISI Research. Data current as of October 2, 2025.
Past performance is not a guarantee of future results.
Chart 2, 1:121— In fact, during most shutdowns since the 1980s, stocks have risen during or shortly after the episode. Investors often view the dip in confidence as temporary, setting the stage for a relief rally once the impasse ends.
Shutdowns may generate short-term volatility, especially if jobs and inflation reports are delayed. But history shows markets tend to recover quickly, often rallying into year-end once the uncertainty clears. This is not the first shutdown—and it likely won’t be the last. From our perspective, what matters most are the fundamentals.
Even if the shutdown delays government data, the underlying trends point to a cooling but still stable economy. These fundamentals are what ultimately drive market performance, rather than the political drama. Markets have become less sensitive to unexpected policy announcements.
Let’s review some fundamentals: Growth has proven more resilient than many expected, and the near-term GDP growth outlook has improved despite elevated uncertainty. Corporate profits for the year continue to exceed forecasts, and corporate margins remain high.
Inflation pressure has arisen based on the administration’s tariff policy, but inflation continues to moderate. The Fed may cut rates further once or twice before year-end, which may be a tailwind for stocks. Ten-year Treasury yields are likely to be stable but lean modestly lower in the near term. The labor market, while softening at the edges, remains intact. Government stimulus through deregulation and tax policy is expected in early 2026. Let’s add to this a seasonal technical measure.
Can the Rally Continue?
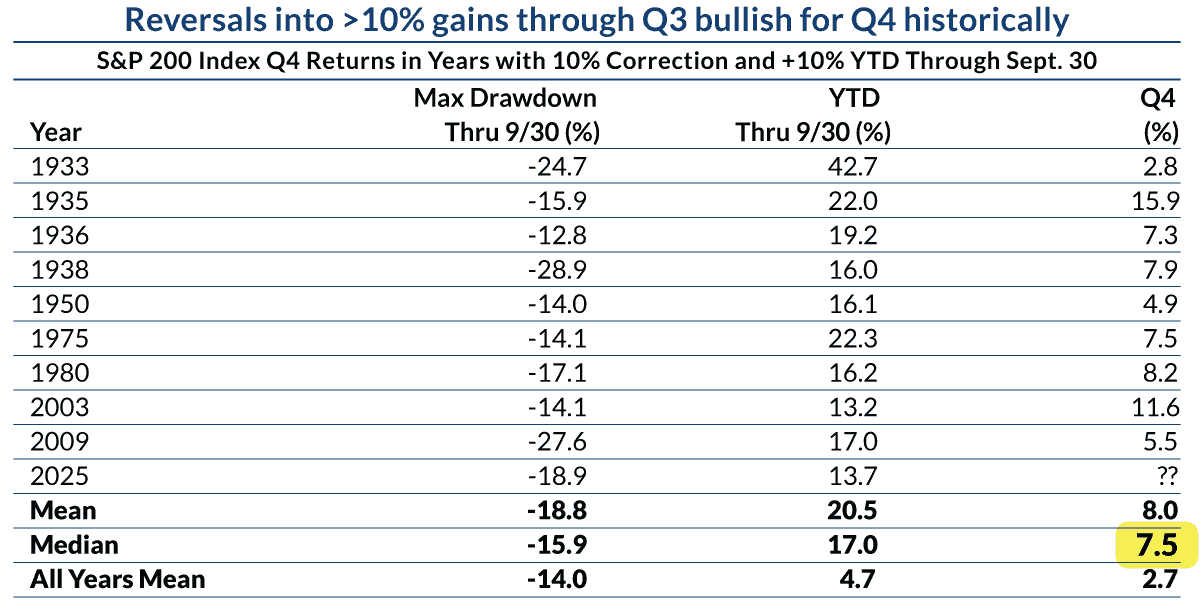
Note: 2025 data is not included in summary statistics.
Source: S&P Dow Jones Indices. Data current as of October 2, 2025.
Past performance is not a guarantee of future results.
Chart 3, 3:02— Historically, the S&P 500 has done well in the 4Q of years where there was an earlier 10% or more correction, followed by a market rally to post 10%+ gains YTD. 2025 clearly fits this paradigm. We had an almost 20% pullback peak to trough in early April (remember Liberation Day?), and as of filming, the S&P 500 is sitting at a little more than 15% YTD.
Supportive fundamentals, momentum, and a historical technical bode well for the markets to finish 2025 favorably.
A few comments as we approach the end of the calendar year for clients with taxable portfolios. Now that it’s the 4Q, we are reassessing where taxable accounts stand on realized capital gains. We advise clients to be prepared for capital gains taxes. The S&P 500 has doubled in the past five years. Generally, there are not many, if any, losses to offset realized gains.
Further, given many factors ranging from tariffs to anticipated deregulation to a shift in monetary policy, just to name a few, we anticipate some changes in our sector, industry, and individual stock allocations. This may be due to a changing environment or simply a stock that has run and we think profits should be realized or rebalancing of portfolio risk characteristics after the strong market run.
We can at times defer taxes and minimize the bill in a specific calendar year, but eventually, if you have gains, the tax man cometh. As always, this is a timely discussion topic when you next speak with your portfolio manager.
Important Information
The views expressed represent the opinions of RBC Rochdale, LLC which are subject to change and are not intended as a forecast or guarantee of future results. Stated information is provided for informational purposes only, and should not be perceived as personalized investment, financial, legal or tax advice or a recommendation for any security. It is derived from proprietary and non-proprietary sources which have not been independently verified for accuracy or completeness.
While Rochdale believes the information to be accurate and reliable, we do not claim or have responsibility for its completeness, accuracy, or reliability. Statements of future expectations, estimates, projections, and other forward-looking statements are based on available information and management's view as of the time of these statements. Accordingly, such statements are inherently speculative as they are based on assumptions which may involve known and unknown risks and uncertainties. Actual results, performance or events may differ materially from those expressed or implied in such statements.
All investing is subject to risk, including the possible loss of the money you invest. As with any investment strategy, there is no guarantee that investment objectives will be met and investors may lose money. Diversification does not ensure a profit or protect against a loss in a declining market.
Equity investing strategies & products. There are inherent risks with equity investing. These risks include, but are not limited to stock market, manager or investment style. Stock markets tend to move in cycles, with periods of rising prices and periods of falling prices.
RBC Rochdale, LLC is an SEC-registered investment adviser and wholly-owned subsidiary of City National Bank. Registration as an investment adviser does not imply any level of skill or expertise. City National Bank is a subsidiary of the Royal Bank of Canada.
© 2025 RBC Rochdale, LLC. All rights reserved.
Index Definitions
The Standard & Poor’s 500 Index (S&P 500): The S&P 500® is widely regarded as the best single gauge of large-cap U.S. equities and serves as the foundation for a wide range of investment products. The index includes 500 leading companies and captures approximately 80% coverage of available market capitalization.
