
-
Market Perspectives
Fall is in the Air, but the Market Keeps Rising
September 2025
- Filename
- Market Perspectives SEPTEMBER 2025.pdf
- Format
- application/pdf
.jpg "Charles Boettcher, CPWA®")
TRANSCRIPT
Equity markets have hit new highs this month. August marked the fourth straight month of gains for the S&P 500, and with about a week to go, it appears September will make it five straight. Month-to-date, the S&P 500 is up over 3%; for the quarter, it’s up over 8%, bringing the Year-to-date return to almost 15%. Growth stocks have now outpaced value stocks year to date, and the familiar sectors communication services and information technology are leading the way. In that manner, 2025 is starting to look a lot like 2024.
US Equity Market Performance

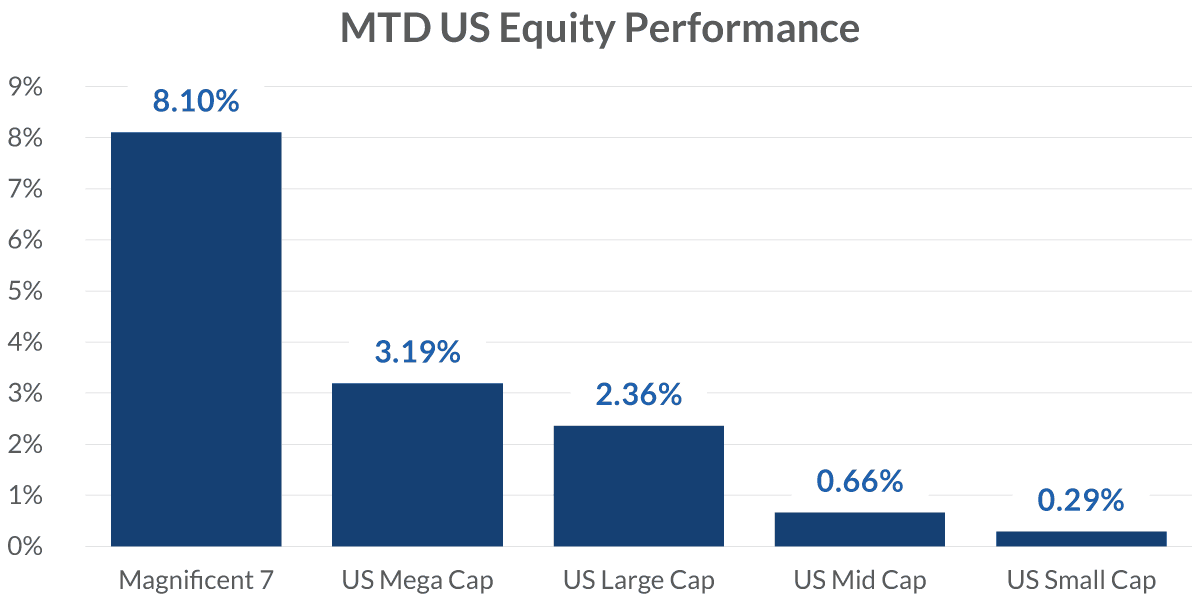
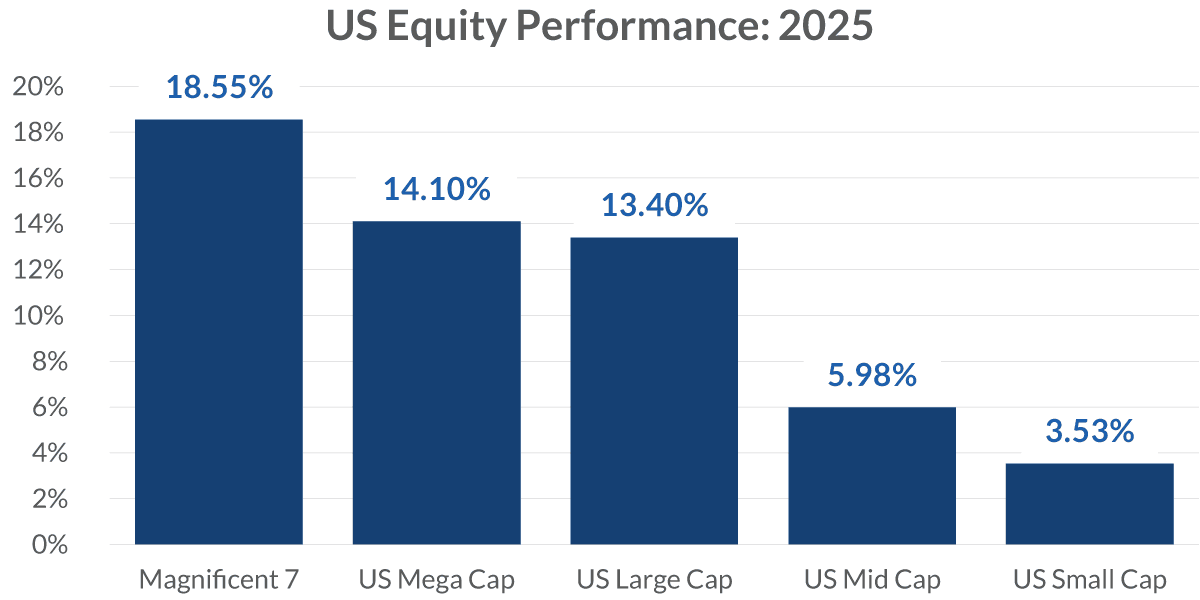
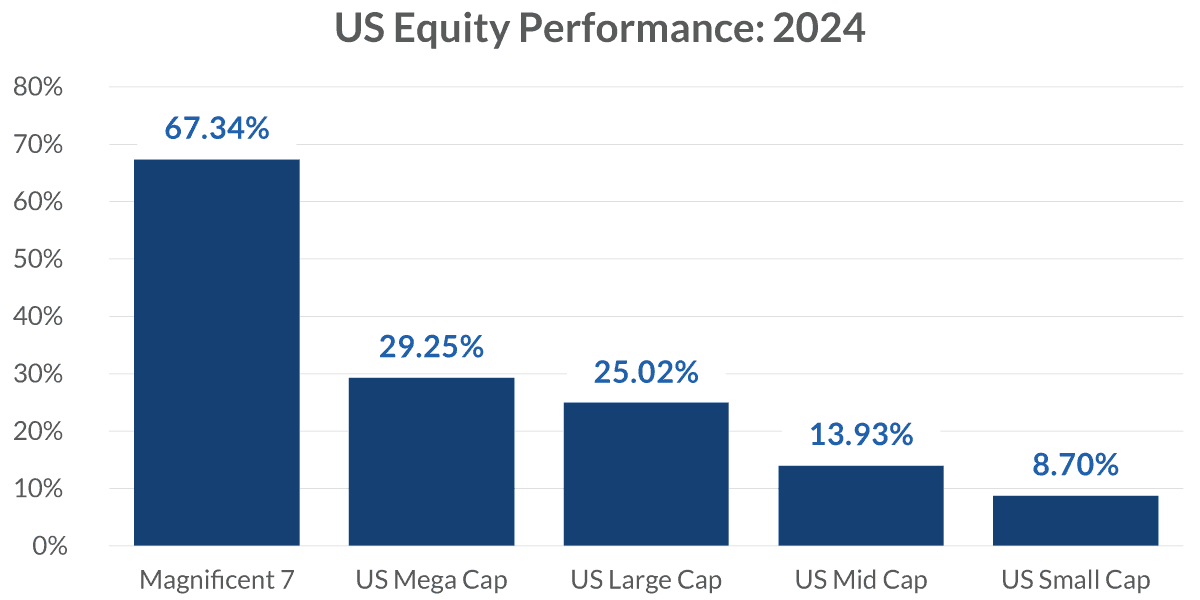
Sources: Bloomberg and Rochdale Research. Data current as of 9/16/2025. US Mega Cap – S&P 100 Index. US Large Cap – S&P 500 Index. US Mid Cap – S&P 400 Index. US Small Cap – S&P 600 Index.
Information is subject to change and is not a guarantee of future results.
Chart 1, 0:49— The bottom two charts illustrate how similar the various areas of U.S. stocks have performed. Larger-cap stocks are ahead of mid- and small-cap stocks and the tech- and AI-focused Magnificent 7 are leading the way… again. The caption is apropos as well as a nod to The Who as they perform their farewell tour.
What’s driving the strength? And can it sustain for the remainder of the year, and into 2026? Earnings have certainly helped.
Corporate Earnings And Margins Are Strong
Sources: Bloomberg and Rochdale Research. Data current as of August 27, 2025.
Information is subject to change and is not a guarantee of future results.
Chart 2, 1:21— Earnings season has been strong, with companies like Broadcom, Microsoft and Google reporting significant growth. The past seven quarters have been above the five-year pre-COVID average. Shift your focus to the right to see that net income margins have been solid. In addition to earnings and margins, the second quarter revenue growth rate was above 6% for the S&P 500 companies in aggregate and consensus estimates are for growth to continue.
Business Is Focused on Continued Growth
1Business spending is defined as capital expenditures
Source: Chief Executive Magazine, Bloomberg Economics. Data current as of August 28, 2025
Information is subject to change and is not a guarantee of future results.
Chart 3, 1:43— Business sentiment has improved and optimism among CEOs is rebounding with many of the trade deals behind us. Second quarter revenue growth was good; growth rates are expected to continue growing. With expectations for continued sales growth, business spending is estimated to grow as well. Corporate financials should benefit.
Looking forward, there are some questions about the market’s valuation, largely elevated by the Magnificent 7 and the ability for AI to push related stocks and sectors further upwards. Or, put another way: Is the AI run creating a bubble? How much longer can the Magnificent 7 drive returns?
Is The AI Run Creating A Bubble?
Sources: Bloomberg, Bloomberg Intelligence, Rochdale Research. Data current as of September 4, 2025.
*Wolfe research Forecast, Nvidia Estimates
Generative AI revenue forecast is the Bloomberg Intelligence forecast based on data from IDC, eMarketer, Statista
Information is subject to change and is not a guarantee of future results.
Chart 4, 2:28— We are starting to see broad-based incorporation of AI across industries. As productivity gains from AI begin to materialize, there will be compelling long-term investment opportunities across a variety of sectors, not just technology, but utilities and real estate, for example. Technology and professional services are adopting AI the fastest, with 71% of firms now using Generative AI in at least one business function. Infrastructure spending is likely to continue, and recent strong revenues from the Magnificent 7 justify the spending. Second quarter Magnificent 7 revenue totaled $550 billion and growth rates are expected to continue growing.
In addition to supportive revenue and earnings growth, the new budget, reduced regulations and increased corporate investment are expected to drive stronger growth in 2026. Further, we just got our first Fed funds rate cut for 2025 — and likely not the last. The current monetary policy path is supportive for further growth. The economy is in a slowdown mode, not a contraction. Consumer and business confidence has stabilized and is rebounding from earlier lows.
So, reasons to be optimistic for the remainder of the year and into 2026.
Important Information
The views expressed represent the opinions of RBC Rochdale, LLC which are subject to change and are not intended as a forecast or guarantee of future results. Stated information is provided for informational purposes only, and should not be perceived as personalized investment, financial, legal or tax advice or a recommendation for any security. It is derived from proprietary and non-proprietary sources which have not been independently verified for accuracy or completeness.
While Rochdale believes the information to be accurate and reliable, we do not claim or have responsibility for its completeness, accuracy, or reliability. Statements of future expectations, estimates, projections, and other forward-looking statements are based on available information and management's view as of the time of these statements. Accordingly, such statements are inherently speculative as they are based on assumptions which may involve known and unknown risks and uncertainties. Actual results, performance or events may differ materially from those expressed or implied in such statements.
Past performance or performance based upon assumptions is no guarantee of future results.
All investing is subject to risk, including the possible loss of the money you invest. As with any investment strategy, there is no guarantee that investment objectives will be met and investors may lose money. Diversification does not ensure a profit or protect against a loss in a declining market.
Equity investing strategies & products. There are inherent risks with equity investing. These risks include, but are not limited to stock market, manager or investment style. Stock markets tend to move in cycles, with periods of rising prices and periods of falling prices.
Fixed Income investing strategies & products. There are inherent risks with fixed income investing. These risks include, but are not limited to, interest rate, call, credit, market, inflation, government policy, liquidity or junk bond risks. When interest rates rise, bond prices fall. This risk is heightened with investments in longer-duration fixed income securities and during periods when prevailing interest rates are low or negative.
RBC Rochdale, LLC is an SEC-registered investment adviser and wholly-owned subsidiary of City National Bank. Registration as an investment adviser does not imply any level of skill or expertise. City National Bank is a subsidiary of the Royal Bank of Canada.
© 2025 RBC Rochdale, LLC. All rights reserved.
Index Definitions
The Bloomberg US Treasury Index measures US dollar-denominated, fixed-rate, nominal debt issued by the US Treasury. Treasury bills are excluded by the maturity constraint but are part of a separate Short Treasury Index. STRIPS are excluded from the index because their inclusion would result in double-counting.
The Magnificent 7 refers to a group of major tech companies with stock growth that far outpaced the high-performing S&P 500 in recent years. Coined in 2023, the group consists of Alphabet, Amazon, Apple, Meta Platforms, Microsoft, Nvidia, and Tesla.
The S&P 100 Index is a market-capitalization-weighted stock market index that tracks the performance of 100 large-cap "blue chip" companies listed on U.S. stock exchanges.
The Standard & Poor’s 500 Index (S&P 500): The S&P 500® is widely regarded as the best single gauge of large-cap U.S. equities and serves as the foundation for a wide range of investment products. The index includes 500 leading companies and captures approximately 80% coverage of available market capitalization.
S&P 400 TR (28 June 1991 base) Standard and Poor's Mid-cap 400 Index is a capitalization-weighted index which measures the performance of the mid-range sector of the U.S. stock market. This index represents the Total return version of MID.
The Standard & Poor's Small-cap 600 Index is a capitalization-weighted index that measures the performance of selected U.S. stocks with a small market capitalization. The index was developed with a base value of 100 as of December 31, 1993.
Stay Informed.
Get our Insights delivered straight to your inbox.


Put our insights to work for you.
If you have a client with more than $1 million in investable assets and want to find out about the benefits of our intelligently personalized portfolio management, speak with an investment consultant near you today.
If you’re a high-net-worth client who's interested in adding an experienced investment manager to your financial team, learn more about working with us here.
